
USD/JPY Forex Technical Analysis – Close Over 108.763 Forms Closing Price Reversal Bottom
The Dollar/Yen is trading slightly higher shortly before the close on Friday. The price action reflects the choppy trade in the U.S. Treasury bond market throughout the session.
U.S. Treasury yields rebounded on Friday after the 10-year rate slipped to 1.53% in the previous session. The yield on the benchmark 10-year Treasury note rose to 1.587% in afternoon trading. The yield on the 30-year Treasury bond climbed to 2.275%.
At 20:26 GMT, the USD/JPY is trading 108.800, up 0.036 or +0.03%.
In U.S. economic news, housing starts jumped 19.4% month-over-month in March, according to the Commerce Department, while building permits rose 2.7%. Additionally, the University of Michigan’s consumer index rose in April to 86.5 from 84.9 a month prior.
Daily Swing Chart Technical Analysis
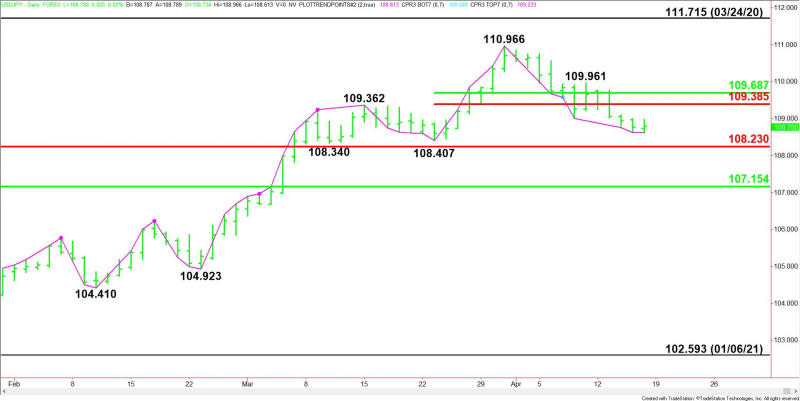
The main trend is up according to the daily swing chart, however, momentum is trending lower. A trade through 108.407 will change the main trend to down. A move through 110.966 will signal a resumption of the uptrend.
The minor trend is down. A trade through 109.961 will change the minor trend to up. This will shift momentum to the upside.
The major support is the retracement zone at 108.230 to 107.154. This zone is controlling the near-term direction of the USD/JPY.
The short-term range is 108.407 to 110.966. The Forex pair is trading on the weak side of its retracement zone at 109.385 to 109.687. This zone is the nearest resistance.
Short-Term Outlook
The USD/JPY is currently trading inside the window of time for a closing price reversal bottom. The direction of the Forex pair into the close on Friday is likely to be determined by trader reaction to 108.763.
Bullish Scenario
A sustained move over 108.763 will indicate the presence of buyers. If this move creates enough late session momentum then look for a spike into at least 109.385.
Bearish Scenario
A sustained move under 108.763 will signal the presence of sellers. If this move creates enough downside momentum then look for the selling to possibly extend into the main bottom at 108.407, followed by the main Fibonacci level at 108.230.
Side Notes
A close under 108.763 will form a closing price reversal bottom. If confirmed on Monday then look for the start of a 2 to 3 day rally into at least 109.385 – 109.687. The move will also shift momentum to the upside.
For a look at all of today’s economic events, check out our economic calendar.
This article was originally posted on FX Empire
More From FXEMPIRE:
Gold Price Futures (GC) Technical Analysis – Trader Reaction to $1788.50 Determines Near-Term Tone
S&P 500 Weekly Price Forecast – Stock Markets Continue to Reach Towards Higher Levels
USD/CAD Daily Forecast – Canadian Dollar Gains Ground Ahead Of The Weekend
Crude Oil Weekly Price Forecast – Crude Oil Markets Have Strong Week
Ethereum, Litecoin, and Ripple’s XRP – Daily Tech Analysis – April 17th, 2021
