
Why Apple, FedEx, Microsoft Stocks Look Ready For Bullish Continuation

Apple, Inc (NASDAQ: AAPL), FedEx Corporation (NYSE: FDX) and Microsoft Corporation (NASDAQ: MSFT) are all trading higher in strong uptrends. An uptrend occurs when a stock consistently makes a series of higher highs and higher lows on the chart.
The higher highs indicate the bulls are in control while the intermittent higher lows indicate consolidation periods. Traders can use moving averages to help identify an uptrend with rising lower frame moving averages (such as the eight-day or 21-day exponential moving averages) indicating the stock is in a steep shorter-term uptrend and rising longer-term moving averages (such as the 200-day simple moving average) indicating a long-term uptrend.
A stock often signals when the higher high is in by printing a reversal candlestick such as a doji, bearish engulfing or hanging man candlestick. Likewise, the higher low could be signaled when a doji, morning star or hammer candlestick is printed. Moreover, the higher highs and higher lows often take place at resistance and support levels.
In an uptrend the "trend is your friend" until it’s not and in an uptrend there are ways for both bullish and bearish traders to participate in the stock:
Bullish traders who are already holding a position in a stock can feel confident the uptrend will continue unless the stock makes a lower low. Traders looking to take a position in a stock trading in an uptrend can enter usually find the safest entry on the higher low.
Bearish traders can enter the trade on the higher high and exit on the pullback. These traders can also enter when the uptrend breaks and the stock makes a lower low indicating a reversal into a downtrend may be in the cards.
See Also: Why This Apple Analyst Expects Clear Upside To Q4 Street Numbers Across The Board
The Apple Chart: Apple reversed into an uptrend on Oct. 4 and Oct. 6 when it hit a low of $138.27 and created a bullish double bottom pattern on the daily chart. The stock then reacted to a falling wedge pattern and broke up bullishly on Oct. 7. Since the date, Apple has created a solid uptrend with consistent higher highs and higher lows.
Between Oct. 13 and Thursday, Apple has also settled into a possible bull flag pattern.

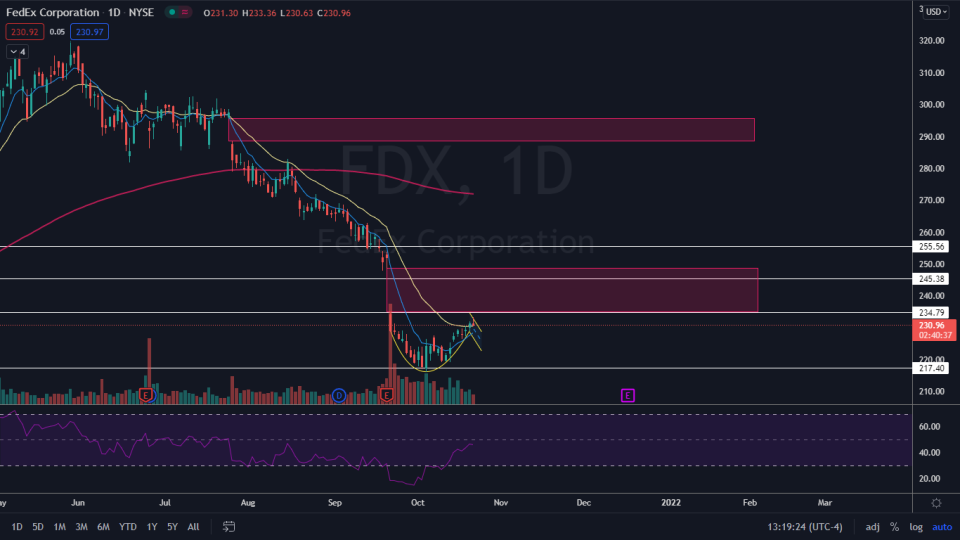
The FedEx Chart: FedEx was trading in a steep downtrend between May 27 and Oct. 5, which caused the stock to lose about 32% of its value. FedEx then reversed course into an uptrend and, like Apple, has created a consistent series of higher highs and higher lows.
FedEx may be settling into a bullish cup and handle pattern, although the pattern isn't a 'true' cup and handle because the formation should usually occur in an uptrend. There is a gap above on FedEx's chart between $234 and $248, which the stock is likely to fill in the future.
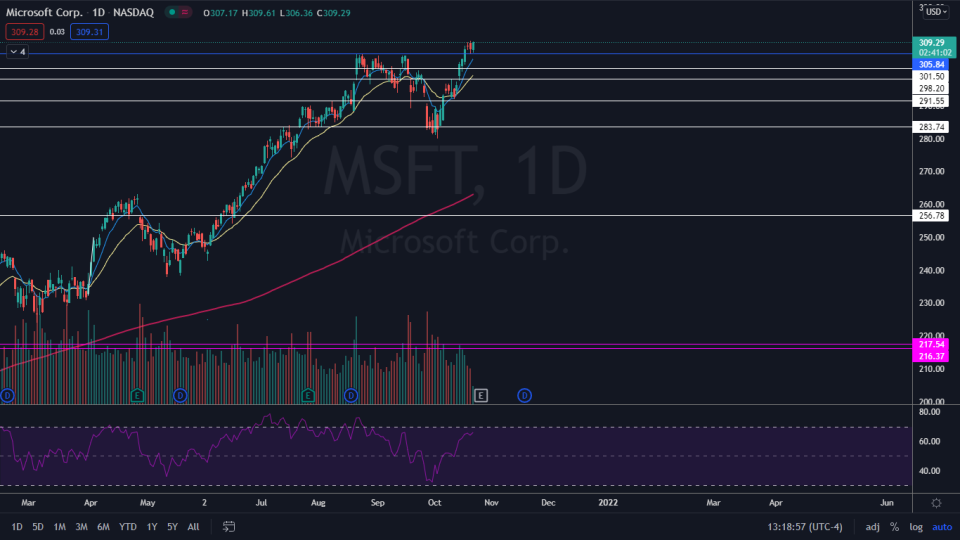
The Microsoft Chart: Microsoft made a new all-time high of $309.70 on Wednesday and on Thursday was attempting to break through to another new all-time high. The stock has been trading in a solid uptrend since Oct. 4 when it reached a low of $280.25.
Like Apple's stock, Microsoft may be printing a bull flag pattern on the daily chart as it gathers the strength for a blue sky run.
See more from Benzinga
© 2021 Benzinga.com. Benzinga does not provide investment advice. All rights reserved.
