
Discover Financial (DFS) Q1 Earnings Miss on High Costs
Discover Financial Services DFS reported first-quarter 2024 adjusted earnings per share (EPS) of $1.10, which missed the Zacks Consensus Estimate by 63.1%. The bottom line declined 69.3% year over year.
DFS' revenues, net of interest expenses, climbed 12.3% year over year to $4.2 billion. The top line beat the consensus mark by 3.7%.
The weak first-quarter earnings were due to escalating operating costs, feeble contributions from the Digital Banking segment and higher provision for credit losses. The company facing challenges from rising charge-offs may have worried the investors. Nevertheless, the negatives were partially offset by receivables growth, deposit inflows and growing PULSE and Diners Club volumes.
Discover Financial Services Price, Consensus and EPS Surprise
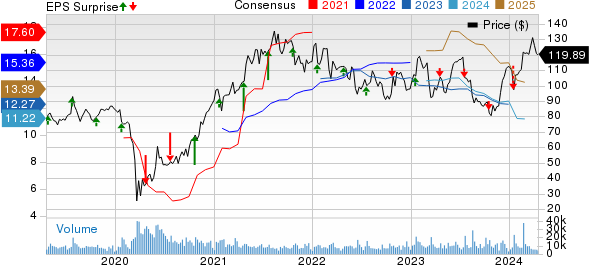
Discover Financial Services price-consensus-eps-surprise-chart | Discover Financial Services Quote
Operational Update
Total operating expenses of $2.3 billion escalated 67% year over year due to increased employee compensation and benefits expenses, marketing and business development costs, professional fees, and information processing & communications expenses. The figure came higher than our estimate of $1.6 billion. Moreover, operating efficiency (total operating expenses divided by revenues, net of interest expenses) deteriorated 1800 basis points (bps) year over year to 54.9% in the first quarter.
Interest expenses increased 55% year over year to $1.5 billion in the quarter under review. Discover Financial’s net income of $308 million tumbled 68% year over year.
Segmental Performance
Digital Banking
The segment reported a pretax income of $322 million, which fell 73% year over year in the first quarter. The decline was due to an increased provision for credit losses and elevated operating expenses, partly offset by growing revenues, net of interest expenses. The metric missed our estimate by 67.2%. Provision for credit losses increased 36% year over year to $1.5 billion.
Total loans rose 12% year over year to $126.6 billion in the quarter under review. Personal loans also grew 21% year over year. Credit card loans advanced 11% year over year, whereas private student loans remained flat year over year.
Net interest income of $3.5 billion climbed 11% year over year in the first quarter thanks to increased average receivables, partially offset by a lower net interest margin. The figure surpassed our estimate of $3.4 billion. The net interest margin deteriorated 31 bps year over year to 11.03%.
Payment Services
The segment's pretax income was $82 million, comparing favorably with the prior-year quarter’s income of $47 million. The significant improvement came from an increase in PULSE revenues. Expanding PULSE and Diners Club volumes also contributed to the upside. The metric surpassed the Zacks Consensus Estimate of $60 million.
The Payment Services volume of $100.3 billion advanced 18% year over year in the first quarter. The PULSE dollar volume rose 21% year over year on improved debit transaction volume. Meanwhile, the Diners Club volume climbed 11% year over year, attributable to continued strength in most of the regions. The Network Partners’ volume increased 4% year over year in the quarter under review due to higher AribaPay volume.
Financial Position (as of Mar 31, 2024)
Discover Financial exited the first quarter with total assets of $152.7 billion, higher than $151.5 billion at 2023-end. The liquidity portfolio (comprising cash and cash equivalents and other investments, excluding cash-in-process) amounted to $25.7 billion, higher than $23.3 billion at 2023-end.
Borrowings decreased from $21.3 billion at 2023-end to $20.5 billion. Total liabilities of $138 billion at the first-quarter end were higher than $136.7 billion at 2023-end. Total equity fell from $14.8 billion at 2023-end to $14.7 billion.
Capital Deployment Update
Management has currently paused share repurchases through merger closing. It declared a quarterly cash dividend of 70 cents per share and expects it to remain at this level.
Merger Update
Discover Financial entered into a definitive agreement in February 2024 to merge with Capital One. This merger will enhance DFS’s network, making it more competitive in the marketplace. However, the closing of the merger is subject to various conditions like regulatory and shareholder approval.
2024 Guidance
Management expects the loans to be up low single this year, while it achieved 15% loan growth in 2023. The net interest margin is forecasted to be in the range of 10.7%-11%, down from the 2023 reported figure of 11.07%.
Operating expenses are estimated to rise in mid-single digits from $6 billion in 2023, excluding merger and card misclassification-related costs. The average net charge-off rate is estimated to be in the range of 4.9-5.2% for the full year. The estimate stands higher than the 2023 figure of 3.42%.
Zacks Rank & Key Picks
Discover Financial currently has a Zacks Rank #3 (Hold).
Some better-ranked stocks in the broader Finance space are Ryan Specialty Holdings, Inc. RYAN, Root, Inc. ROOT and Brown & Brown, Inc. BRO, each carrying a Zacks Rank #2 (Buy) at present. You can see the complete list of today’s Zacks #1 Rank (Strong Buy) stocks here.
The Zacks Consensus Estimate for Ryan Specialty’s 2024 full-year earnings indicates a 28.3% year-over-year increase. It beat earnings estimates in two of the past four quarters and met twice, with an average surprise of 5.1%. Also, the consensus mark for RYAN’s 2024 full-year revenues suggests 19.5% year-over-year growth.
The consensus mark for Root’s 2024 full-year earnings indicates a 23.1% year-over-year improvement. The earnings estimate has witnessed three upward estimate revisions in the past month against no movement in the opposite direction. Furthermore, the consensus estimate for ROOT’s 2024 full-year revenues suggests 101.8% year-over-year growth.
The Zacks Consensus Estimate for Brown & Brown’s 2024 full-year earnings is pegged at $3.55 per share, which indicates 26.3% year-over-year growth. The estimate jumped 14 cents over the past month. BRO beat earnings estimates in each of the past four quarters, with an average surprise of 11.2%.
Want the latest recommendations from Zacks Investment Research? Today, you can download 7 Best Stocks for the Next 30 Days. Click to get this free report
Discover Financial Services (DFS) : Free Stock Analysis Report
Brown & Brown, Inc. (BRO) : Free Stock Analysis Report
Root, Inc. (ROOT) : Free Stock Analysis Report
Ryan Specialty Holdings Inc. (RYAN) : Free Stock Analysis Report
