
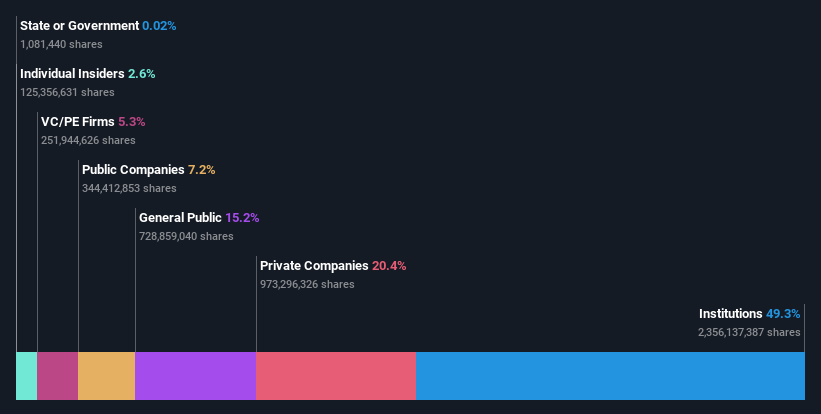
Nu Holdings Ltd. (NYSE:NU) is favoured by institutional owners who hold 49% of the company
Key Insights
Institutions' substantial holdings in Nu Holdings implies that they have significant influence over the company's share price
A total of 11 investors have a majority stake in the company with 51% ownership
Using data from analyst forecasts alongside ownership research, one can better assess the future performance of a company
A look at the shareholders of Nu Holdings Ltd. (NYSE:NU) can tell us which group is most powerful. The group holding the most number of shares in the company, around 49% to be precise, is institutions. That is, the group stands to benefit the most if the stock rises (or lose the most if there is a downturn).
Given the vast amount of money and research capacities at their disposal, institutional ownership tends to carry a lot of weight, especially with individual investors. As a result, a sizeable amount of institutional money invested in a firm is generally viewed as a positive attribute.
Let's take a closer look to see what the different types of shareholders can tell us about Nu Holdings.
Check out our latest analysis for Nu Holdings
What Does The Institutional Ownership Tell Us About Nu Holdings?
Institutional investors commonly compare their own returns to the returns of a commonly followed index. So they generally do consider buying larger companies that are included in the relevant benchmark index.
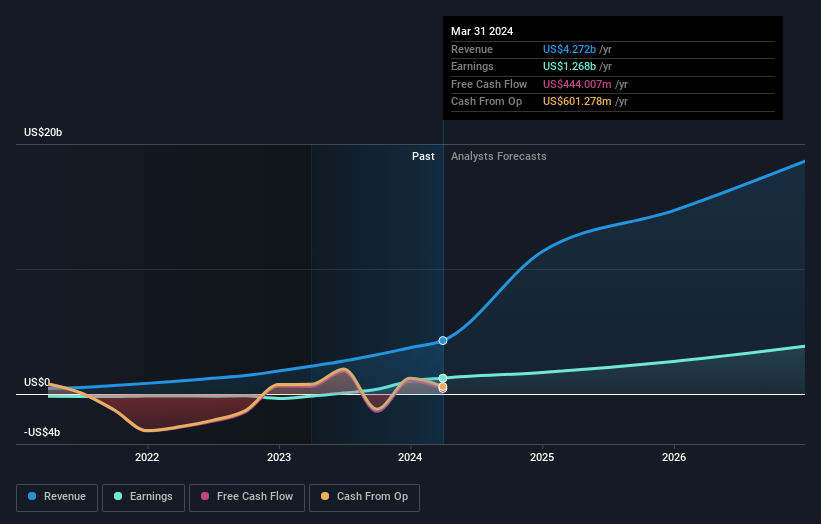
As you can see, institutional investors have a fair amount of stake in Nu Holdings. This can indicate that the company has a certain degree of credibility in the investment community. However, it is best to be wary of relying on the supposed validation that comes with institutional investors. They too, get it wrong sometimes. If multiple institutions change their view on a stock at the same time, you could see the share price drop fast. It's therefore worth looking at Nu Holdings' earnings history below. Of course, the future is what really matters.
Hedge funds don't have many shares in Nu Holdings. Our data shows that Rua California Ltd. is the largest shareholder with 20% of shares outstanding. For context, the second largest shareholder holds about 5.3% of the shares outstanding, followed by an ownership of 5.0% by the third-largest shareholder.
Looking at the shareholder registry, we can see that 51% of the ownership is controlled by the top 11 shareholders, meaning that no single shareholder has a majority interest in the ownership.
While studying institutional ownership for a company can add value to your research, it is also a good practice to research analyst recommendations to get a deeper understand of a stock's expected performance. There are plenty of analysts covering the stock, so it might be worth seeing what they are forecasting, too.
Insider Ownership Of Nu Holdings
The definition of an insider can differ slightly between different countries, but members of the board of directors always count. The company management answer to the board and the latter should represent the interests of shareholders. Notably, sometimes top-level managers are on the board themselves.
Most consider insider ownership a positive because it can indicate the board is well aligned with other shareholders. However, on some occasions too much power is concentrated within this group.
We can report that insiders do own shares in Nu Holdings Ltd.. Insiders own US$1.5b worth of shares (at current prices). Most would say this shows a good alignment of interests between shareholders and the board. Still, it might be worth checking if those insiders have been selling.
General Public Ownership
With a 15% ownership, the general public, mostly comprising of individual investors, have some degree of sway over Nu Holdings. This size of ownership, while considerable, may not be enough to change company policy if the decision is not in sync with other large shareholders.
Private Equity Ownership
With an ownership of 5.3%, private equity firms are in a position to play a role in shaping corporate strategy with a focus on value creation. Sometimes we see private equity stick around for the long term, but generally speaking they have a shorter investment horizon and -- as the name suggests -- don't invest in public companies much. After some time they may look to sell and redeploy capital elsewhere.
Private Company Ownership
It seems that Private Companies own 20%, of the Nu Holdings stock. Private companies may be related parties. Sometimes insiders have an interest in a public company through a holding in a private company, rather than in their own capacity as an individual. While it's hard to draw any broad stroke conclusions, it is worth noting as an area for further research.
Public Company Ownership
We can see that public companies hold 7.2% of the Nu Holdings shares on issue. It's hard to say for sure but this suggests they have entwined business interests. This might be a strategic stake, so it's worth watching this space for changes in ownership.
Next Steps:
I find it very interesting to look at who exactly owns a company. But to truly gain insight, we need to consider other information, too.
I always like to check for a history of revenue growth. You can too, by accessing this free chart of historic revenue and earnings in this detailed graph.
If you would prefer discover what analysts are predicting in terms of future growth, do not miss this free report on analyst forecasts.
NB: Figures in this article are calculated using data from the last twelve months, which refer to the 12-month period ending on the last date of the month the financial statement is dated. This may not be consistent with full year annual report figures.
Have feedback on this article? Concerned about the content? Get in touch with us directly. Alternatively, email editorial-team (at) simplywallst.com.
This article by Simply Wall St is general in nature. We provide commentary based on historical data and analyst forecasts only using an unbiased methodology and our articles are not intended to be financial advice. It does not constitute a recommendation to buy or sell any stock, and does not take account of your objectives, or your financial situation. We aim to bring you long-term focused analysis driven by fundamental data. Note that our analysis may not factor in the latest price-sensitive company announcements or qualitative material. Simply Wall St has no position in any stocks mentioned.
