
Be Wary Of Kobay Technology Bhd (KLSE:KOBAY) And Its Returns On Capital
If we want to find a stock that could multiply over the long term, what are the underlying trends we should look for? Typically, we'll want to notice a trend of growing return on capital employed (ROCE) and alongside that, an expanding base of capital employed. Ultimately, this demonstrates that it's a business that is reinvesting profits at increasing rates of return. Although, when we looked at Kobay Technology Bhd (KLSE:KOBAY), it didn't seem to tick all of these boxes.
Return On Capital Employed (ROCE): What Is It?
For those who don't know, ROCE is a measure of a company's yearly pre-tax profit (its return), relative to the capital employed in the business. Analysts use this formula to calculate it for Kobay Technology Bhd:
Return on Capital Employed = Earnings Before Interest and Tax (EBIT) ÷ (Total Assets - Current Liabilities)
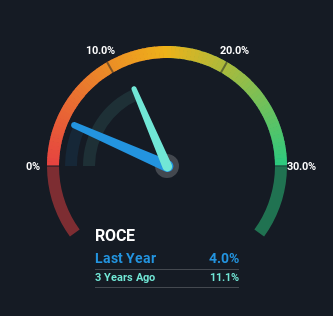
0.04 = RM18m ÷ (RM597m - RM151m) (Based on the trailing twelve months to March 2024).
So, Kobay Technology Bhd has an ROCE of 4.0%. Ultimately, that's a low return and it under-performs the Machinery industry average of 9.0%.
Check out our latest analysis for Kobay Technology Bhd
In the above chart we have measured Kobay Technology Bhd's prior ROCE against its prior performance, but the future is arguably more important. If you'd like, you can check out the forecasts from the analysts covering Kobay Technology Bhd for free.
What Can We Tell From Kobay Technology Bhd's ROCE Trend?
On the surface, the trend of ROCE at Kobay Technology Bhd doesn't inspire confidence. Around five years ago the returns on capital were 11%, but since then they've fallen to 4.0%. And considering revenue has dropped while employing more capital, we'd be cautious. If this were to continue, you might be looking at a company that is trying to reinvest for growth but is actually losing market share since sales haven't increased.
While on the subject, we noticed that the ratio of current liabilities to total assets has risen to 25%, which has impacted the ROCE. If current liabilities hadn't increased as much as they did, the ROCE could actually be even lower. Keep an eye on this ratio, because the business could encounter some new risks if this metric gets too high.
The Key Takeaway
From the above analysis, we find it rather worrisome that returns on capital and sales for Kobay Technology Bhd have fallen, meanwhile the business is employing more capital than it was five years ago. The market must be rosy on the stock's future because even though the underlying trends aren't too encouraging, the stock has soared 386%. In any case, the current underlying trends don't bode well for long term performance so unless they reverse, we'd start looking elsewhere.
If you want to continue researching Kobay Technology Bhd, you might be interested to know about the 2 warning signs that our analysis has discovered.
If you want to search for solid companies with great earnings, check out this free list of companies with good balance sheets and impressive returns on equity.
Have feedback on this article? Concerned about the content? Get in touch with us directly. Alternatively, email editorial-team (at) simplywallst.com.
This article by Simply Wall St is general in nature. We provide commentary based on historical data and analyst forecasts only using an unbiased methodology and our articles are not intended to be financial advice. It does not constitute a recommendation to buy or sell any stock, and does not take account of your objectives, or your financial situation. We aim to bring you long-term focused analysis driven by fundamental data. Note that our analysis may not factor in the latest price-sensitive company announcements or qualitative material. Simply Wall St has no position in any stocks mentioned.
