
Alaska Air (ALK) Incurs Q1 Loss, Tops Revenue Estimates
Alaska Air Group, Inc. ALK reported first-quarter 2024 loss per share of 92 cents, which was narrower than the Zacks Consensus Estimate of a loss of $1.09. In the year-ago reported quarter, ALK reported a loss of 62 cents per share.
Operating revenues of $2,232 million surpassed the Zacks Consensus Estimate of $2,179.3 million. The top line jumped 2% year over year, with passenger revenues accounting for 89.7% of the top line and increasing 1% owing to continued recovery in air-travel demand.
Passenger revenues totaled $2,004 million in the reported quarter. On a year-over-year basis, cargo and other revenues of $64 million grew 10% year over year. Mileage plan other revenues grew 6% to $164 million.
Alaska Air Group, Inc. Price, Consensus and EPS Surprise
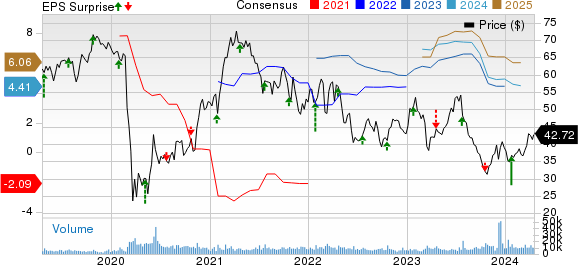
Alaska Air Group, Inc. price-consensus-eps-surprise-chart | Alaska Air Group, Inc. Quote
Total revenue per available seat mile (a key measure of unit revenues) grew 4% year over year to 14.51 cents. Yield increased 1% to 16.00 cents.
Reflecting the uptick in air-travel demand, consolidated traffic (measured in revenue passenger miles) remained almost flat at 12.52 billion. To cater to this increased demand, capacity (measured in average seat miles) fell 2% to 15.37 billion. Consolidated load factor (percentage of seats filled by passengers) increased 1.5 percentage points to 81.4% in the first quarter of 2024.The actual figure for the load factor was lower than our expectation of 84.9%.
In the first quarter, total operating expenses (on a reported basis) grew 1% year over year to $2,398 million.
Economic fuel price per gallon fell 10% to $3.08. The actual figure was lower than our estimate of $3.10.
Consolidated operating costs per available seat mile (excluding fuel and special items) grew 11% year over year to 11.60 cents. The actual figure was lower than our estimate of 10.94 cents.
Liquidity
As of Mar 31, 2024, Alaska Air had $2,278 million of cash and marketable securities compared with $1,791 million at the end of December 2023.
ALK exited the first quarter of 2024 with long-term debt (net of current portion) of $2,264 million compared with $2,182 million at the end of December 2023. Debt-to-capitalization ratio was 47%.
ALK utilized $292 million of cash in operating activities in the first quarter. During the first quarter of 2024, ALK repurchased nearly 561,086 shares for $21 million.
Outlook
ALK anticipates second-quarter 2024 earnings per share (EPS) between $2.20 and $2.40. For the second quarter of 2024, Alaska Air anticipates the economic fuel cost per gallon to be in the range of $3.00-$3.20. The company expects available seat miles (a measure of capacity) to increase in the range of 5%-7% in the second quarter of 2024 from second-quarter 2023 actuals.
ALK anticipates 2024 EPS between $3.25 and $5.25. Capacity (measured in available seat miles) for 2024 is expected to increase by less than 3% from 2023 actuals.Capital expenditures are expected to be between $1.2 billion and $1.3 billion. Full year tax rate is anticipated to be around 25%.
Currently, Alaska Air carries a Zacks Rank #3 (Hold). You can see the complete list of today’s Zacks #1 Rank (Strong Buy) stocks here.
Performances of Other Transportation Companies
Delta Air Lines DAL reported first-quarter 2024 earnings (excluding 39 cents from non-recurring items) of 45 cents per share, which comfortably beat the Zacks Consensus Estimate of 36 cents. Earnings increased 80% on a year-over-year basis.
Revenues of $13.75 billion surpassed the Zacks Consensus Estimate of $12.84 billion and increased 7.75% on a year-over-year basis, driven by strong air-travel demand. Adjusted operating revenues (excluding third-party refinery sales) came in at $12.56 billion, up 6% year over year.
United Airlines Holdings, Inc. (UAL)reported first-quarter 2024 loss per share (excluding 23 cents from non-recurring items) of 15 cents, which was narrower than the Zacks Consensus Estimate loss of 53 cents. In the year-ago reported quarter, UAL reported a loss of 63 cents per share.
Operating revenues of $12,539 million beat the Zacks Consensus Estimate of $12,428.4 million. The top line increased 9.7% year over year due to upbeat air-travel demand. This was driven by a 10.1% rise in passenger revenues (accounting for 90.2% of the top line) to $11,313 million. Almost 39,325 passengers traveled on UAL flights in the first quarter, up 6.8% year over year.
J.B. Hunt Transport Services, Inc.’s JBHT first-quarter 2024 earnings of $1.22 per share missed the Zacks Consensus Estimate of $1.53 and declined 35.5% year over year.
JBHT’s total operating revenues of $2,944 million missed the Zacks Consensus Estimate of $3,117.1 million and fell 8.8% year over year. Total operating revenues, excluding fuel surcharge revenue, fell 7% year over year. The downfall was owing to a 9% decrease in segment gross revenue per load in both Intermodal (JBI) and Truckload (JBT), 22% fewer loads in Integrated Capacity Solution (ICS), and a modest decline in average trucks and productivity in Dedicated Contract Services (DCS). Revenue declines in JBI, ICS, JBT and DCS were partially offset by Final Mile Services (FMS) revenue growth of 2%, primarily driven by new contracts implemented over the past year.
Want the latest recommendations from Zacks Investment Research? Today, you can download 7 Best Stocks for the Next 30 Days. Click to get this free report
Delta Air Lines, Inc. (DAL) : Free Stock Analysis Report
United Airlines Holdings Inc (UAL) : Free Stock Analysis Report
J.B. Hunt Transport Services, Inc. (JBHT) : Free Stock Analysis Report
Alaska Air Group, Inc. (ALK) : Free Stock Analysis Report
