
F5 (FFIV) Q2 Earnings Surpass Estimates, Revenues Fall Y/Y

F5, Inc. FFIV reported mixed second-quarter fiscal 2024 results. This Seattle, WA-based company’s non-GAAP earnings of $2.91 per share beat the Zacks Consensus Estimate of $2.88 and increased 13.8% from the year-ago quarter’s $2.53.
The bottom line was at the higher end of management’s guidance range of $2.79-$2.91 per share. The robust bottom-line performance reflects the combined impact of gross margin improvement and disciplined operating expense management.
F5’s revenues of $681 million for the fiscal second quarter missed the consensus mark of $686.9 million and declined 3.1% on a year-over-year basis. However, revenues came within the company’s guidance range of $675-$695 million.
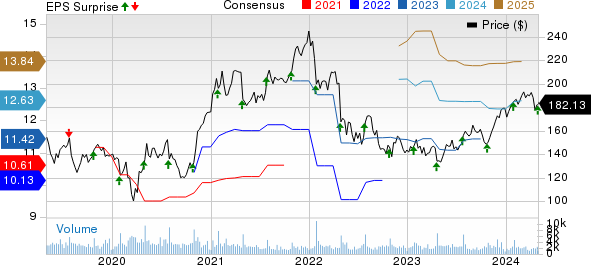
F5, Inc. Price, Consensus and EPS Surprise
F5, Inc. price-consensus-eps-surprise-chart | F5, Inc. Quote
Top Line in Detail
Product revenues (44% of total revenues), which comprise the Software and Systems sub-divisions, decreased 12% year over year to $300.2 million. The decline in Product revenues was mainly due to lower Systems sales, partially offset by increased Software sales. The company’s reported non-GAAP Product revenues were lower than our estimate of $317.8 million.
Systems revenues plunged 32% year over year to $142 million, accounting for approximately 47% of the total Product revenues. The company revealed that the decline reflects a lower level of backlog-related shipments compared with prior quarters, while the demand shows some signs of stabilization. Our estimate for Systems revenues was pegged at $157.2 million.
The negative impacts of lower Systems sales were partially offset by the improved performance of Software. Software revenues climbed 20% year over year to $159 million in the fiscal second quarter, mainly driven by 28% growth in subscription software revenues. Software revenues mainly grew on the back of renewals. Our estimate was pegged at $160.6 million.
Global Service revenues (56% of the total revenues) grew 5% to $381 million. The robust growth was mainly driven by price increases introduced in fiscal 2022. Our estimate for Global Services revenues was pegged at $367.8 million.
F5 registered lower sales across the EMEA and APAC regions, witnessing a year-over-year decrease of 6% and 9%, respectively. However, revenues from the Americas region grew 1% on a year-over-year basis. Revenue contributions from the Americas, EMEA and APAC regions were 57%, 26% and 17%, respectively.
Customer-wise, Enterprises, Service providers and Government represented 69%, 13% and 19% of product bookings, respectively.
Margins
On a year-over-year basis, GAAP and non-GAAP gross margins expanded 140 basis points (bps) and 170 bps to 79.3% and 82.1%, respectively. The improvement was driven by price realization and ease in supply-chain constraints, as well as reductions in ancillary supply-chain costs.
The company’s fiscal second-quarter GAAP operating expenses declined 9.3% to $400.3 million, while non-GAAP operating expenses decreased 6.8% to $348.8 million. GAAP operating expenses as a percentage of revenues decreased to 58.8% in the second quarter of fiscal 2024 from 62.8% reported in the year-ago quarter. Meanwhile, non-GAAP operating expenses as a percentage of revenues declined to 53% from 51% in the year-ago quarter.
F5’s GAAP operating profit jumped 32.1% to $140 million, while the margin expanded 540 bps to 20.5%. Moreover, the non-GAAP operating profit jumped 9.94% year over year to $210 million, while the margin improved 370 bps to 30.9%. An increase in the non-GAAP operating margin was primarily driven by an improvement in the gross margin and lower operating expenses as a percentage of revenues.
Balance Sheet & Cash Flow
F5 exited the March-ended quarter with cash and short-term investments of $903.4 million compared with the previous quarter’s $826 million. The company generated an operating cash flow of $386.95 million in the fiscal second quarter.
During the fiscal second quarter, FFIV repurchased shares worth $100 million. As of Apr 29, 2024, F5 had $672 million remaining under its current authorized share repurchase program. The company is committed to using at least 50% of free cash flow for share repurchases.
Guidance
F5 projects non-GAAP revenues in the $675-$695 million band (midpoint of $685 million) and non-GAAP earnings per share (EPS) in the range of $2.89-$3.01 (midpoint of $2.95) for the third quarter of fiscal 2024. The non-GAAP gross margin is forecasted between 82% and 83%.
The company expects non-GAAP operating expenses between $340 million and $352 million for the fiscal third quarter. Share-based compensation expenses are anticipated in the range of $55-$57 million.
For fiscal 2024, F5 reaffirms revenue growth forecast of flat to a low-single-digit-percentage decline. Non-GAAP gross and operating margins are still anticipated in the ranges of 82-83% and 33-34%, respectively.
However, the company raised the non-GAAP EPS growth guidance range to 7-9% from 6-8% projected earlier. F5 now projects the effective tax rate for fiscal 2024 to be 20-22% from the 21-22% projected previously.
Moreover, FFIV still intends to return at least 50% of its fiscal 2024 free cash flow to shareholders through share buybacks.
Zacks Rank and Other Stocks to Consider
Currently, F5 carries a Zacks Rank #2 (Buy). Shares of the company have returned 35.7% in the past year.
Some other top-ranked stocks from the broader technology sector are Dell Technologies DELL, Arista Networks ANET and Crexendo CXDO, each sporting a Zacks Rank #1 (Strong Buy) at present. You can see the complete list of today’s Zacks #1 Rank stocks here.
The Zacks Consensus Estimate for DELL’s 2024 earnings per share has been revised upward by 54 cents to $7.64 in the past 60 days. Shares of DELL have surged 191.4% in the past year.
The Zacks Consensus Estimate for ANET's 2024 earnings per share has been revised upward by 3 cents to $7.49 in the past 30 days. Shares of ANET have gained 64.7% in the past year.
The Zacks Consensus Estimate for CXDO’s 2024 earnings per share has been revised upward by 6 cents to 23 cents in the past 60 days. Shares of CXDO have skyrocketed 202.2% in the past year.
Want the latest recommendations from Zacks Investment Research? Today, you can download 7 Best Stocks for the Next 30 Days. Click to get this free report
Dell Technologies Inc. (DELL) : Free Stock Analysis Report
F5, Inc. (FFIV) : Free Stock Analysis Report
Arista Networks, Inc. (ANET) : Free Stock Analysis Report
Crexendo Inc. (CXDO) : Free Stock Analysis Report
