
Grainger (GWW) Q1 Earnings Beat Estimates, Revenues Rise Y/Y
W.W. Grainger, Inc. GWW has reported earnings per share of $9.62 in first-quarter 2024, beating the Zacks Consensus Estimate of $9.58. The bottom line improved 0.1% year over year.
Grainger’s quarterly revenues rose 3.5% year over year to $4.24 billion. The top line missed the Zacks Consensus Estimate of $4.27 billion. Daily sales increased 3.5% from the prior-year quarter. We predicted daily sales to increase 4.2%.
The High-Touch Solutions N.A. segment’s daily sales rose 3.4% in the quarter from the first quarter of 2023, driven by solid volume growth. Our model predicted year-over-year organic daily sales growth of 3.7%.
The Endless Assortment segment’s daily sales grew 3.7% in the quarter due to increased customer acquisition across the segment and enterprise customer growth at MonotaRO. The upside was partially offset by declining sales from non-core customers at Zoro. Our model predicted year-over-year organic daily sales growth of 8.1% for the quarter.
W.W. Grainger, Inc. Price, Consensus and EPS Surprise
W.W. Grainger, Inc. price-consensus-eps-surprise-chart | W.W. Grainger, Inc. Quote
Operational Update
Cost of sales increased 4.5% year over year to $2.57 billion. The gross profit rose 2.1% year over year to $1.67 billion. The gross margin fell to 39.4% in the quarter from the prior-year period’s 39.9%.
Grainger’s operating income in the quarter was down 1.6% year over year to $669 million. The operating margin was 15.8% down from 16.6% in the prior-year quarter.
Financial Position
The company had cash and cash equivalents of $804 million at the end of the first quarter of 2024, up from $660 million at 2023-end. Cash flow from operating activities was $661 million in the first quarter of 2024 compared with $454 million in the prior-year quarter. Long-term debt was $1.78 billion as of Mar 31, 2024, compared with $2.27 billion as of Dec 31, 2023. Grainger returned $360 million to shareholders through dividends and share buybacks in the first quarter.
2024 Outlook
Grainger expects net sales between $17.2 billion and $17.7 billion. Sales growth is anticipated to be 4.3-7.3%. Daily sales growth is envisioned at 4-7%. Earnings per share are expected to be $38.00-$40.50.
Price Performance
In the past year, Grainger’s shares have gained 44% compared with the industry’s growth of 11.5%.
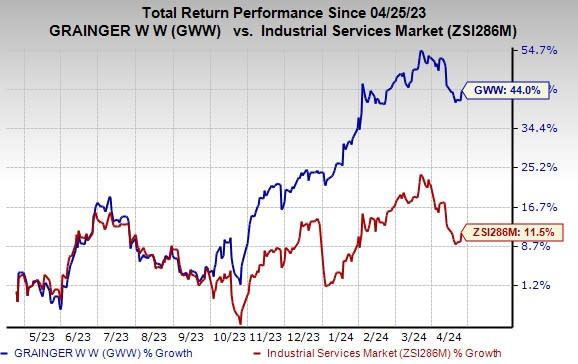
Image Source: Zacks Investment Research
Zacks Rank & Other Stocks to Consider
Grainger currently carries a Zacks Rank #2 (Buy).
Some other top-ranked stocks from the Industrial Products sector are Applied Industrial Technologies AIT, Chart Industries, Inc. GTLS and Cadre Holdings, Inc. CDRE. AIT currently sports a Zacks Rank #1 (Strong Buy), and GTLS and CDRE carry a Zacks Rank #2. You can see the complete list of today's Zacks #1 Rank stocks here.
Applied Industrial has an average trailing four-quarter earnings surprise of 13.9%. The Zacks Consensus Estimate for AIT’s 2024 earnings is pinned at $9.49 per share, which indicates year-over-year growth of 7.8%. Estimates have moved north by 1% in the past 60 days. The company’s shares have gained 35.4% in the past year.
The Zacks Consensus Estimate for Chart Industries’ 2024 earnings is pegged at $11.98 per share. The consensus estimate for 2024 earnings has moved 6% north in the past 60 days and suggests year-over-year growth of 93.6%. The company has a trailing four-quarter average earnings surprise of 75.9%. GTLS shares have gained 12.2% in the past year.
The Zacks Consensus Estimate for Cadre Holdings’ 2024 earnings is pegged at $1.18 per share. The consensus estimate for 2024 earnings has moved 7% north in the past 60 days and suggests year-over-year growth of 16.7%. The company has a trailing four-quarter average earnings surprise of 33%. CDRE shares have gained 53.1% in the past year.
Want the latest recommendations from Zacks Investment Research? Today, you can download 7 Best Stocks for the Next 30 Days. Click to get this free report
W.W. Grainger, Inc. (GWW) : Free Stock Analysis Report
Applied Industrial Technologies, Inc. (AIT) : Free Stock Analysis Report
Chart Industries, Inc. (GTLS) : Free Stock Analysis Report
Cadre Holdings, Inc. (CDRE) : Free Stock Analysis Report
