Honeywell (HON) Q1 Earnings Beat, Aerospace Sales Rise Y/Y
Honeywell International Inc. HON reported first-quarter 2024 adjusted earnings of $2.25 per share, which surpassed the Zacks Consensus Estimate of $2.18. The bottom line inched up 9% year over year on an adjusted basis. On a reported basis, the company’s earnings were $2.23 per share, indicating an increase of 8%.
Total revenues of $9.1 billion beat the consensus estimate of $9 billion. The top line inched up around 3% from the year-ago quarter driven by strength in the Aerospace Technologies segment. Organic sales also increased 3% year over year.
Segmental Details
In October 2023, HON planned to realign its business segments to three megatrends: automation, the future of aviation and energy transition. Beginning in the first quarter of 2024, the company started operating under the segments discussed below.
Aerospace Technologies’ quarterly revenues were $3.7 billion, up 15% year over year. Growth in both commercial aviation and defense and space markets drove revenues in the quarter. Our estimate for Aerospace Technologies revenues in the first quarter was $3.5 billion.
Industrial Automation revenues fell 12% year over year to $2.5 billion due to lower volumes in warehouse and workflow solutions, which was partially offset by growth in lifecycle solutions and services business. Our estimate for segmental revenues was pegged at $2.6 billion.
Building Automation revenues totaled $1.4 billion, down 4% year over year. Its revenues decreased due to declining volume in the building products business. Our estimate for the segment’s revenues in the first quarter was $1.5 billion.
Energy and Sustainability Solutions’ revenues increased 4% to $1.5 billion due to strength in advanced materials business and increased demand for fluorine products. Our estimate for the segment’s revenues was $1.4 billion.
Costs/Margins
The company’s total cost of sales (cost of products and services) in the reported quarter was $5.6 billion, up 1.6% year over year. Selling, general and administrative expenses were $1.30 billion, down 1.1%. Interest expenses and other financial charges were $220 million compared with $170 million a year ago.
Operating income in the first quarter was $1.9 billion, up 9.9% year over year. The operating income margin was 20.4% compared with 19.1% in the year-ago period.
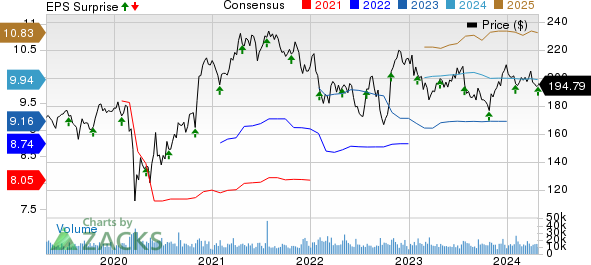
Honeywell International Inc. Price, Consensus and EPS Surprise
Honeywell International Inc. price-consensus-eps-surprise-chart | Honeywell International Inc. Quote
Balance Sheet/Cash Flow
Honeywell had cash and cash equivalents of $11.8 billion compared with $7.9 billion at the end of December 2023. Long-term debt was $22.2 billion, higher than $16.6 billion in 2023 end.
In the first three months of 2024, it generated net cash of $448 million from operating activities against $784 million cash spent in the prior year. Capital expenditure totaled $233 million in the first three months of 2024 compared with $193 million in the previous year.
Free cash flow was $215 million in the first quarter against $977 million cash outflow in the year-ago period.
2024 Guidance
For 2024, Honeywell, currently carrying a Zacks Rank #3 (Hold), expects sales of $38.1-$38.9 billion, whereas it reported $36.7 billion in 2023. Organic sales are expected to increase 4-6%. You can see the complete list of today’s Zacks #1 Rank (Strong Buy) stocks here.
HON expects a segment margin in the band of 23-23.3% compared with 22.7% in 2023. Adjusted earnings per share are expected to be between $9.80 and $10.10, higher than $9.16 in 2023.
It expects operating cash flow in the range of $6.7-$7.1 billion for 2024, higher than $5.3 billion generated in 2023. Free cash flow is expected to be around $5.6-$6 billion.
Performance of Other Companies
Danaher Corporation’s DHR first-quarter 2024 adjusted earnings (excluding 47 cents from non-recurring items) of $1.92 per share surpassed the Zacks Consensus Estimate of $1.72. The bottom line declined 27.1% year over year.
Danaher’s net sales of $5.8 billion outperformed the consensus estimate of $5.6 billion. However, the metric declined 2.5% year over year due to lower core sales in the Biotechnology segment.
Markel Group’s MKL first-quarter 2024 adjusted earnings of $22.43 per share beat the Zacks Consensus Estimate of $19.17. This compares with earnings of $13.78 per share a year ago.
Markel’s revenues of $3.7 billion missed the consensus estimate by 2.19%. This compares with year-ago revenues of $3.4 billion.
IDEX Corporation’s IEX first-quarter 2024 adjusted earnings of $1.88 per share surpassed the Zacks Consensus Estimate of $1.75. On a year-over-year basis, the bottom line decreased approximately 10.1%.
In the quarter under review, IDEX’s net sales of $800.5 million underperformed the consensus estimate of $805 million. The top line also decreased 5.3% year over year.
Want the latest recommendations from Zacks Investment Research? Today, you can download 7 Best Stocks for the Next 30 Days. Click to get this free report
Honeywell International Inc. (HON) : Free Stock Analysis Report
Danaher Corporation (DHR) : Free Stock Analysis Report
IDEX Corporation (IEX) : Free Stock Analysis Report
Markel Group Inc. (MKL) : Free Stock Analysis Report

 雅虎香港財經

