
The Price Is Right For SIGNA Sports United N.V. (NYSE:SSU)
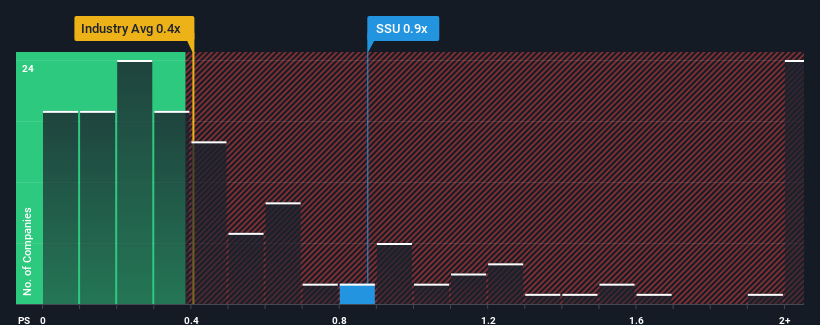
It's not a stretch to say that SIGNA Sports United N.V.'s (NYSE:SSU) price-to-sales (or "P/S") ratio of 0.9x right now seems quite "middle-of-the-road" for companies in the Specialty Retail industry in the United States, where the median P/S ratio is around 0.4x. Although, it's not wise to simply ignore the P/S without explanation as investors may be disregarding a distinct opportunity or a costly mistake.
Check out our latest analysis for SIGNA Sports United
What Does SIGNA Sports United's P/S Mean For Shareholders?
SIGNA Sports United certainly has been doing a good job lately as it's been growing revenue more than most other companies. It might be that many expect the strong revenue performance to wane, which has kept the P/S ratio from rising. If not, then existing shareholders have reason to be feeling optimistic about the future direction of the share price.
If you'd like to see what analysts are forecasting going forward, you should check out our free report on SIGNA Sports United.
How Is SIGNA Sports United's Revenue Growth Trending?
SIGNA Sports United's P/S ratio would be typical for a company that's only expected to deliver moderate growth, and importantly, perform in line with the industry.
Taking a look back first, we see that the company grew revenue by an impressive 19% last year. The strong recent performance means it was also able to grow revenue by 64% in total over the last three years. Accordingly, shareholders would have definitely welcomed those medium-term rates of revenue growth.
Shifting to the future, estimates from the three analysts covering the company suggest revenue should grow by 4.7% over the next year. That's shaping up to be similar to the 5.2% growth forecast for the broader industry.
With this in mind, it makes sense that SIGNA Sports United's P/S is closely matching its industry peers. Apparently shareholders are comfortable to simply hold on while the company is keeping a low profile.
What We Can Learn From SIGNA Sports United's P/S?
We'd say the price-to-sales ratio's power isn't primarily as a valuation instrument but rather to gauge current investor sentiment and future expectations.
Our look at SIGNA Sports United's revenue growth estimates show that its P/S is about what we expect, as both metrics follow closely with the industry averages. Right now shareholders are comfortable with the P/S as they are quite confident future revenue won't throw up any surprises. If all things remain constant, the possibility of a drastic share price movement remains fairly remote.
And what about other risks? Every company has them, and we've spotted 4 warning signs for SIGNA Sports United (of which 1 shouldn't be ignored!) you should know about.
If these risks are making you reconsider your opinion on SIGNA Sports United, explore our interactive list of high quality stocks to get an idea of what else is out there.
Have feedback on this article? Concerned about the content? Get in touch with us directly. Alternatively, email editorial-team (at) simplywallst.com.
This article by Simply Wall St is general in nature. We provide commentary based on historical data and analyst forecasts only using an unbiased methodology and our articles are not intended to be financial advice. It does not constitute a recommendation to buy or sell any stock, and does not take account of your objectives, or your financial situation. We aim to bring you long-term focused analysis driven by fundamental data. Note that our analysis may not factor in the latest price-sensitive company announcements or qualitative material. Simply Wall St has no position in any stocks mentioned.
Join A Paid User Research Session
You’ll receive a US$30 Amazon Gift card for 1 hour of your time while helping us build better investing tools for the individual investors like yourself. Sign up here
