
American Equity (AEL) Q4 Earnings Top Estimates, Rise Y/Y
American Equity Investment Life Holding Company AEL reported fourth-quarter 2023 adjusted net earnings of $1.99 per share, which beat the Zacks Consensus Estimate by 15%. The bottom line increased 21.3% year over year.
The quarterly results reflected increased annuity product charges, improved investment income and other revenues, offset by lower premiums and higher expenses.
American Equity Investment Life Holding Company Price, Consensus and EPS Surprise
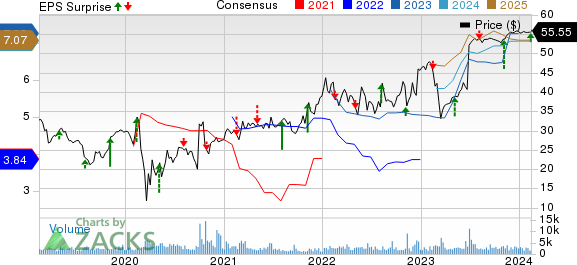
American Equity Investment Life Holding Company price-consensus-eps-surprise-chart | American Equity Investment Life Holding Company Quote
Operational Update
Operating total revenues were $703.7 million, up 14.3% year over year due to higher annuity product charges, net investment income and other revenues.
Premiums and other considerations decreased 11% year over year to $2.6 million. The figure was higher than our estimate of $2.2 million. Annuity product charges increased 57.2% year over year to $96.9 million. The figure was higher than our estimate of $62.3 million.
Net investment income rose 8.2% on a year-over-year basis to $582 million. The figure was higher than our estimate of $570.8 million.
Total expenses more than doubled year over year to $1.6 billion. The figure was higher than our estimate of $507.8 million.
The investment spread was 2.64%, up from 2.54% in the year-ago quarter.
Financial Update
Cash and cash equivalents were $9.8 billion as of Dec 31, 2023, which surged fivefold from 2022-end. Total investments were $48.2 billion, which decreased 6% from 2022-end.
Notes and loan payable totaled $785.4 million, down 0.8% from 2022-end.
Book value per common share, excluding average accumulated other comprehensive income (AOCI), was $66.84, up 5% from 2022-end.
Total debt/total capitalization was 12.8%, deteriorating 20 basis points from 2022-end.
Non-GAAP operating return on equity, excluding average AOCI and net impact of fair value accounting for fixed index annuities, was 18.7%.
Full-Year Highlights
Total operating revenues for 2023 were $2.7 billion, which increased 2.9% year over year.
Adjusted earnings for 2023 were $7.50 per share, which surged 75.6% year over year.
Net Investment income was $2.3 billion in 2023, which decreased 1.5% year over year.
Zacks Rank
American Equity currently carries a Zacks Rank #3 (Hold). You can see the complete list of today’s Zacks #1 Rank (Strong Buy) stocks here.
Performance of Other Life Insurers
Lincoln National Corporation LNC reported fourth-quarter 2023 adjusted earnings of $1.45 per share, which outpaced the Zacks Consensus Estimate by 9.9%. The bottom line surged 90.8% year over year. Adjusted operating revenues of $2 billion plunged 56.6% year over year in the quarter under review. The top line lagged the consensus mark by 55.7%. Fee income inched up 0.5% year over year to $1.4 billion, which almost touched the Zacks Consensus Estimate. Insurance premiums were a negative figure of $1.1 billion.
Net investment income of $1.4 billion dipped 0.1% year over year but beat the consensus mark of $1.3 billion. Meanwhile, other revenues climbed 32.1% year over year. Total expenses decreased 19% year over year to $2.3 billion in the fourth quarter. Commissions and other expenses fell 1.2% year over year, while interest and debt expenses witnessed a year-over-year increase of 5.2% during the same time frame. Lincoln National incurred a net loss of $1.2 billion against the year-ago quarter’s net income of $812 million.
Brighthouse Financial Inc. BHF reported fourth-quarter 2023 adjusted net income of $2.92 per share, which missed the Zacks Consensus Estimate by 23.8%. The bottom line declined 16.8% year over year. The results reflected higher revenues, offset by higher expenses. Total operating revenues of $2.1 billion increased 5.4% year over year, driven by higher premiums, net investment income and other income. The top line beat the consensus mark by 0.2%. Premiums of $226 million increased 35.5% year over year.
Adjusted net investment income was $1.2 billion in the quarter under review, up 13.3% year over year, primarily driven by alternative investment income, asset growth and higher interest rates. The investment income yield was 4.16%. Total expenses were $2.6 million. Corporate expenses, pretax, were $224 million, a slight decrease from $243 million incurred in the year ago quarter.
Sun Life Financial Inc. SLF delivered fourth-quarter 2023 underlying net income of $1.23 per share, which beat the Zacks Consensus Estimate by 5.1%. However, the bottom line decreased 1.6% year over year. Underlying net income was $722 million (C$983 million), which increased 10% year over year. Revenues of $13.7 billion increased 51.5% on a year-over-year basis.
Wealth sales & asset management gross flows of $33.7 billion (C$45.8 billion) increased 5.7% year over year. Group - Health & Protection sales of $1.1 billion (C$1.5 billion) improved 8.5% year over year. Individual - Protection sales of $519.6 million (C$707 million) jumped 42% year over year. The new business contractual service margin was $280 million (C$381 million), up 51% year over year.
Want the latest recommendations from Zacks Investment Research? Today, you can download 7 Best Stocks for the Next 30 Days. Click to get this free report
Lincoln National Corporation (LNC) : Free Stock Analysis Report
American Equity Investment Life Holding Company (AEL) : Free Stock Analysis Report
Sun Life Financial Inc. (SLF) : Free Stock Analysis Report
Brighthouse Financial, Inc. (BHF) : Free Stock Analysis Report
