
Greif (GEF) Q2 Earnings Beat Estimates, Sales Increase Y/Y
Greif, Inc. GEF reported adjusted earnings per share (EPS) of 82 cents in second-quarter fiscal 2024 (ended Apr 30, 2024), which surpassed the Zacks Consensus Estimate of 77 cents. The bottom line fell 54% year over year. Results were impacted by elevated raw material, transportation and manufacturing costs, and higher SG&A expenses, reflecting increased compensation expenses and costs incurred for strategic investments.
Including one-time items, EPS was 77 cents in the quarter compared with $1.90 in the prior-year quarter.
Operational Update
Sales rose 4.1% year over year to $1.37 billion. The top line surpassed the Zacks Consensus Estimate of $1.31 billion.
The cost of sales rose 10.4% year over year to $1.1 billion. Gross profit amounted to $270 million, down 13.4% from the prior-year quarter. The gross margin came in at 19.7% compared with the prior-year quarter’s 23.8%.
Selling, general and administrative (SG&A) expenses were $167 million, up 21.9% year over year. Adjusted EBITDA decreased 25.7% year over year to $170 million in the fiscal second quarter.
Greif, Inc. Price, Consensus and EPS Surprise
Greif, Inc. price-consensus-eps-surprise-chart | Greif, Inc. Quote
Segmental Performance
Sales in the Global Industrial Packaging segment rose 7.6% year over year to $805 million. Our model projected revenues of $748 million for the quarter. The segment’s adjusted EBITDA amounted to $118 million compared with the year-ago quarter’s $121 million.
The Paper Packaging segment’s sales increased 1.1% year over year to $561 million in the fiscal second quarter. The figure surpassed our estimated sales of $548 million. The segment’s adjusted EBITDA fell to $49 million from the prior-year quarter’s $105 million.
The Land Management segment’s sales totaled $5.4 million in the reported quarter compared with $5.9 million in the year-ago quarter. We projected the segment's sales to be $5.7 million in the quarter. Adjusted EBITDA was $2.6 million compared with the year-earlier quarter’s $2.5 million.
Financial Position
Greif reported cash and cash equivalents of $196 million at the end of second-quarter fiscal 2024 compared with $181 million at the end of fiscal 2023. Cash flow from operating activities totaled $88 million in the quarter under review compared with $211 million in the prior-year quarter.
Long-term debt amounted to $2.78 billion as of Apr 30, 2024, compared with $2.12 billion as of Oct 31, 2023.
On Jun 3, Greif’s board announced a quarterly cash dividend of 52 cents per share of Class A Common Stock and 78 cents per share of Class B Common Stock. The dividends will be paid out on Jul 1 to shareholders of record at the close of business as of Jun 1, 2024.
Outlook
Greif expects fiscal 2024 adjusted EBITDA between $675 million and $725 million, up from the prior announced $610 million. The adjusted free cash flow is anticipated between $175 million and $225 million.
Price Performance
GEF shares have gained 1.2% in the past year compared with the industry’s growth of 14.5%.
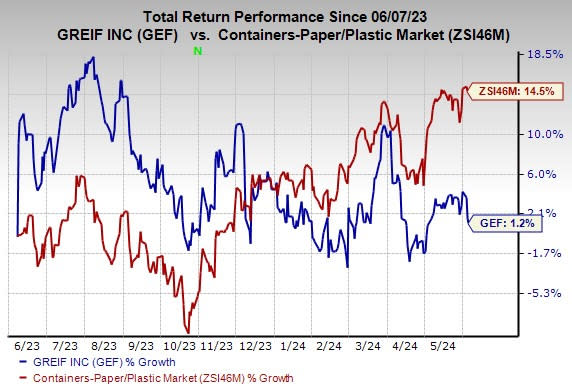
Image Source: Zacks Investment Research
Zacks Rank
Greif currently carries a Zacks Rank #3 (Hold). You can see the complete list of today's Zacks #1 Rank (Strong Buy) stocks here.
Performances of Other Packaging Stocks
AptarGroup, Inc. ATR reported a first-quarter 2024 (ended Mar 31, 2024) adjusted EPS of $1.26, beating the Zacks Consensus Estimate of $1.13. The bottom line increased 31% from 95 cents (including comparable exchange rates) per share in the year-ago quarter, aided by strong sales growth in the Pharma business, and a continued margin expansion in the Beauty and Closures businesses.
AptarGroup’s total revenues increased 6.4% year over year to $915 million, surpassing the Zacks Consensus Estimate of $897 million. Core sales, excluding currency and acquisition effects, improved 5% year over year.
Sonoco Products Co. SON reported an adjusted EPS of $1.12 in the first quarter of 2024 (ended Mar 31, 2024), beating the Zacks Consensus Estimate of $1.08. The bottom line fell 20% from the prior-year quarter as gains from improved productivity were offset by price/cost pressures and lower volumes.
Sonoco’s net sales were $1.64 billion, which lagged the consensus estimate of $1.69 billion. The top line declined 5.3% year over year on lower volumes and pricing, somewhat offset by acquisitions.
Packaging Corporation of America PKG reported an adjusted EPS of $1.72 in the first quarter of 2024 (ended Mar 31, 2024), beating the Zacks Consensus Estimate of $1.63. The bottom line dipped 22% year over year mainly due to lower prices, and a mix in the Packaging and Paper segments. These were partially offset by higher volumes in the Packaging and Paper segments.
PKG’s sales in the quarter rose 0.2% year over year to $1.98 billion. The top line surpassed the Zacks Consensus Estimate of $1.91 billion.
Want the latest recommendations from Zacks Investment Research? Today, you can download 7 Best Stocks for the Next 30 Days. Click to get this free report
Sonoco Products Company (SON) : Free Stock Analysis Report
Packaging Corporation of America (PKG) : Free Stock Analysis Report
AptarGroup, Inc. (ATR) : Free Stock Analysis Report
Greif, Inc. (GEF) : Free Stock Analysis Report
