
Dutch Lady Milk Industries Berhad's (KLSE:DLADY) Stock Has Seen Strong Momentum: Does That Call For Deeper Study Of Its Financial Prospects?
Dutch Lady Milk Industries Berhad (KLSE:DLADY) has had a great run on the share market with its stock up by a significant 38% over the last three months. Given that stock prices are usually aligned with a company's financial performance in the long-term, we decided to study its financial indicators more closely to see if they had a hand to play in the recent price move. Particularly, we will be paying attention to Dutch Lady Milk Industries Berhad's ROE today.
Return on Equity or ROE is a test of how effectively a company is growing its value and managing investors’ money. In other words, it is a profitability ratio which measures the rate of return on the capital provided by the company's shareholders.
Check out our latest analysis for Dutch Lady Milk Industries Berhad
How Do You Calculate Return On Equity?
ROE can be calculated by using the formula:
Return on Equity = Net Profit (from continuing operations) ÷ Shareholders' Equity
So, based on the above formula, the ROE for Dutch Lady Milk Industries Berhad is:
17% = RM72m ÷ RM437m (Based on the trailing twelve months to December 2023).
The 'return' is the yearly profit. So, this means that for every MYR1 of its shareholder's investments, the company generates a profit of MYR0.17.
What Has ROE Got To Do With Earnings Growth?
Thus far, we have learned that ROE measures how efficiently a company is generating its profits. We now need to evaluate how much profit the company reinvests or "retains" for future growth which then gives us an idea about the growth potential of the company. Assuming all else is equal, companies that have both a higher return on equity and higher profit retention are usually the ones that have a higher growth rate when compared to companies that don't have the same features.
A Side By Side comparison of Dutch Lady Milk Industries Berhad's Earnings Growth And 17% ROE
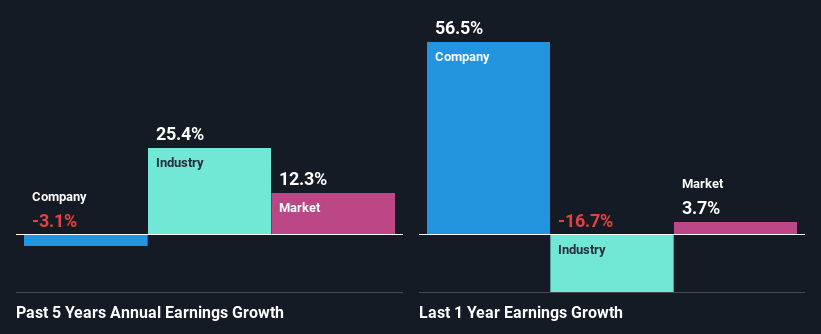
To start with, Dutch Lady Milk Industries Berhad's ROE looks acceptable. Further, the company's ROE compares quite favorably to the industry average of 7.5%. Needless to say, we are quite surprised to see that Dutch Lady Milk Industries Berhad's net income shrunk at a rate of 3.1% over the past five years. Therefore, there might be some other aspects that could explain this. For example, it could be that the company has a high payout ratio or the business has allocated capital poorly, for instance.
So, as a next step, we compared Dutch Lady Milk Industries Berhad's performance against the industry and were disappointed to discover that while the company has been shrinking its earnings, the industry has been growing its earnings at a rate of 25% over the last few years.
Earnings growth is an important metric to consider when valuing a stock. What investors need to determine next is if the expected earnings growth, or the lack of it, is already built into the share price. Doing so will help them establish if the stock's future looks promising or ominous. One good indicator of expected earnings growth is the P/E ratio which determines the price the market is willing to pay for a stock based on its earnings prospects. So, you may want to check if Dutch Lady Milk Industries Berhad is trading on a high P/E or a low P/E, relative to its industry.
Is Dutch Lady Milk Industries Berhad Making Efficient Use Of Its Profits?
With a high three-year median payout ratio of 57% (implying that 43% of the profits are retained), most of Dutch Lady Milk Industries Berhad's profits are being paid to shareholders, which explains the company's shrinking earnings. The business is only left with a small pool of capital to reinvest - A vicious cycle that doesn't benefit the company in the long-run.
In addition, Dutch Lady Milk Industries Berhad has been paying dividends over a period of at least ten years suggesting that keeping up dividend payments is way more important to the management even if it comes at the cost of business growth. Our latest analyst data shows that the future payout ratio of the company is expected to drop to 40% over the next three years.
Summary
Overall, we feel that Dutch Lady Milk Industries Berhad certainly does have some positive factors to consider. Yet, the low earnings growth is a bit concerning, especially given that the company has a high rate of return. Investors could have benefitted from the high ROE, had the company been reinvesting more of its earnings. As discussed earlier, the company is retaining a small portion of its profits. Having said that, looking at current analyst estimates, we found that the company's earnings growth rate is expected to see a huge improvement. To know more about the company's future earnings growth forecasts take a look at this free report on analyst forecasts for the company to find out more.
Have feedback on this article? Concerned about the content? Get in touch with us directly. Alternatively, email editorial-team (at) simplywallst.com.
This article by Simply Wall St is general in nature. We provide commentary based on historical data and analyst forecasts only using an unbiased methodology and our articles are not intended to be financial advice. It does not constitute a recommendation to buy or sell any stock, and does not take account of your objectives, or your financial situation. We aim to bring you long-term focused analysis driven by fundamental data. Note that our analysis may not factor in the latest price-sensitive company announcements or qualitative material. Simply Wall St has no position in any stocks mentioned.
