
Options Alert: Asymmetric Trade Setup in the Russell 2000
At this point, we are all aware that the Russell 2000 has severely underperformed the broad market indexes over the last year.
The chart below illustrates just how wide the performance gap between the Russell 2000 and the S&P 500 is. We can see that the two indexes were quite correlated until Q2 2023. It was at that point that a banking crisis ensued, and interest rate policy expectations began to change.
Russel 2000 ETF Poised to Catchup?
However, I believe we are likely to see this spread close, and the Russell 2000 ETF IWM may play catch upagainst the S&P 500 ETF SPY in the coming months.
Although there are a number of potential catalysts that may instigate the catchup, I think it will likely be interest rate related, as the persistently high interest rates have been a major drag on the small cap index.
But just as important is that options on IWM are extremely cheap, offering a compelling opportunity for those interested in the trade thesis. Additionally, one of the greatest hedge fund managers in the world just boosted this exact trade to the largest position in his portfolio.
Below is my optimal option trade structure as well as the investor who likes the trade.
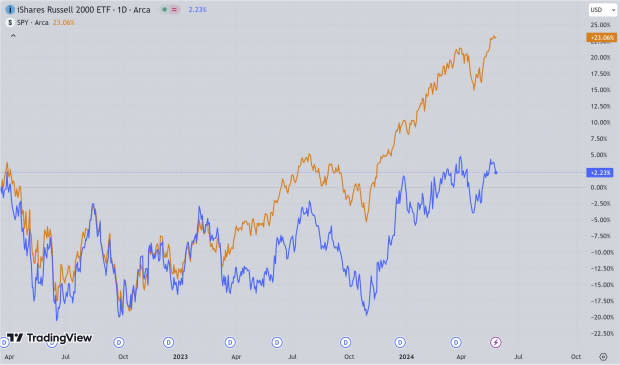
Image Source: TradingView
Finding Cheap Options: Implied Volatility
One of the most important considerations when trading options is the implied volatility. Implied volatility is a metric that reflects the market's expectations of future price fluctuations for a security or index. It is derived from the price of options and indicates the anticipated volatility over the option's lifespan. Higher implied volatility suggests greater expected movement, while lower implied volatility indicates less expected movement. It is commonly used by traders to gauge market sentiment and potential price swings.
The process for determining when the market favors buying versus selling an option is pretty straightforward and involves implied volatility.
Traders should buy an option when implied volatility (IV) is relatively low and look to sell options when the implied volatility is relatively high, when it fits with a trading thesis.
Implied Volatility and IWM Stock Today
If you are looking to buy an option, but the IV is already relatively high, you are severely limiting the upside potential, and buying the underlying stock is likely to be the better expression of the trade.
Whereas if you are an option seller, you want to see high IV priced into the options, because it gives you a juicier premium to collect if you sell the option.
Figuring out if implied volatility is low or high can be done by looking at the IV percentile. IV percentile measures where the current implied volatility stands relative to its range over a specific period, typically the past year. It indicates the percentage of time that the IV has been lower than its current level. For example, an IV percentile of 80% means that the current IV is higher than it has been 80% of the time during the measured period, suggesting higher-than-average volatility expectations.
As of today, IWM has an implied volatility of 18.6% and an IV percentile of 18%. This means that buying options could offer significantly asymmetric returns.
IWM Trade Setup and Strike Selection
In addition to the performance spread between IWM and SPY, there are some seasonal factors that are drawing me to the trade as well.
In the seasonality chart below we can see that the mid-May to late-June period is one of the most bullish segments of the year for the small cap index.
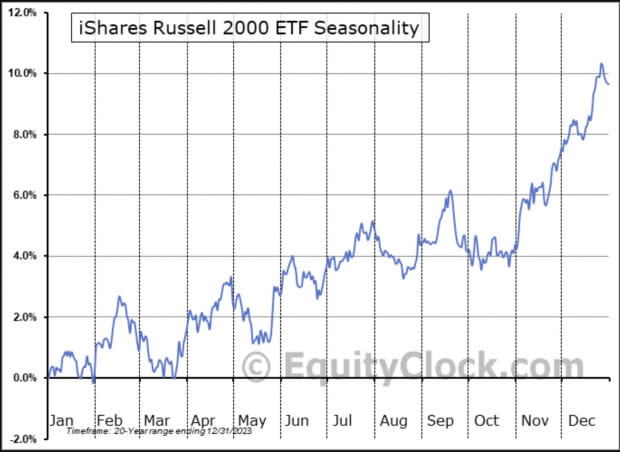
Image Source: EquityClock
But even more encouraging is the chart below which shows that it is also the strongest period of the year relative to the S&P 500. This leads me to believe that if there were a time during the year that the performance gap can close, it is likely to happen around this time.
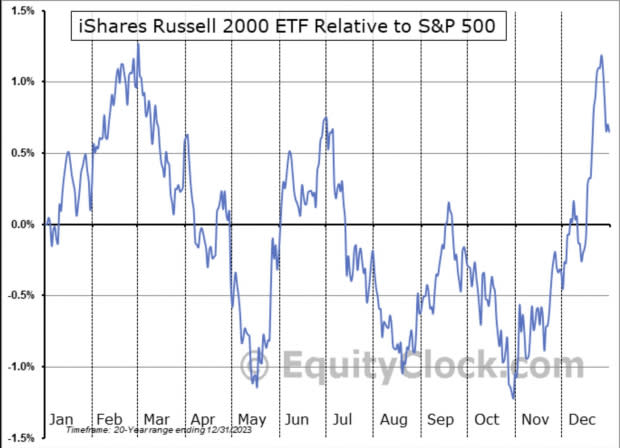
Image Source: EquityClock
So based on these bullish factors I am setting the $220 level as the general target for the trade, which is an estimated mid-point between SPY and IWM performance. Additionally, I will be giving the market 3 months to play out but would expect it to take less time than that.
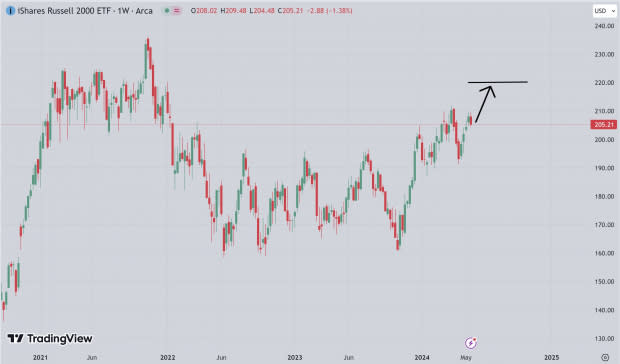
Image Source: TradingView
Now for picking the option to trade.
After trading options for the last ten years, I have found an extremely simple and effective method for structuring these speculative trades.
While many traders like using spreads and advanced multi-leg strategies, I am a fan of simply buying 30 delta calls (puts). This way I can risk the trade to $0, and the only trade management necessary is selling the option to take profit. If your trade is wrong, you can just let the option expire worthless.
I prefer risking the full premium in the option because it gives me very explicit risk management.
Additionally, the 30-delta option gives a perfect mix of lower priced options, medium distance to being in-the-money, and high asymmetry. Lower delta and the strikes are too far from the current price, and higher delta lowers the asymmetry.
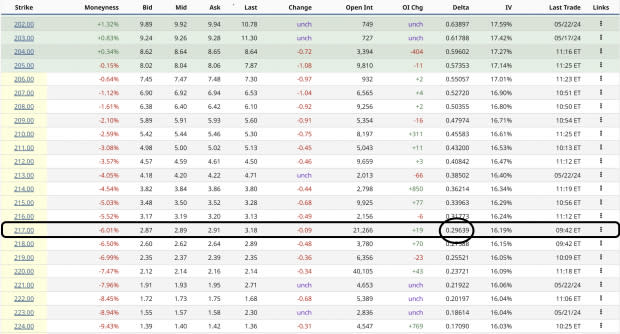
Image Source: Barchart
IWM August 16 Long Call
Buy $217 Call @ $2.89
Upfront Trade Cost: $289 per contract
Maximum risk: $289.00
Maximum return: infinite (on upside)
P.S. remember that each contract is quoted at the per-share rate but represents 100 shares of the underlying security.
In the table below, we can see a range of potential outcomes from the trade. My base case for the trade is that IWM reaches the $220 target by early June. Highlighted in the table we see that if the stock can reach the target by early July, we can expect ~157% return or $455 per contract.
That would be a tidy return for just over a month!
Of course, there are a range of different possible outcomes, getting to or exceeding the target sooner, later, or not at all, with returns ranging from 350% to -100%. But most importantly, we know the maximum amount of risk built into the trade, allowing us to properly fit it into a portfolio.
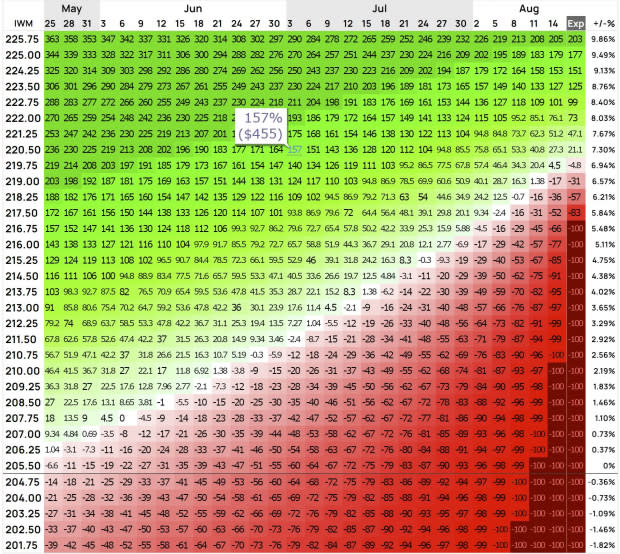
Image Source: Options Profit Calculator
Stanley Druckenmiller likes the IWM Trade
According to the most recent 13f report, which discloses the stock holdings of money managers with more than $100 million, Druckenmiller’s firm Duquesne Family Office added a huge new position in the last quarter.
The report says that IWM call options are currently the largest position in Stan Druckenmiller’s equity portfolio, making up 15% of the total holdings. Although I had the idea before consulting with one of the macro trading greats, I was extremely encouraged by his huge position.
However, I should note that these 13f reports only share the long holdings of a portfolio and none of the shorts, so it is unclear if this is a naked long position or one leg of a long/short trade.
Thus, I don’t think the trade should be followed exclusively because Stanley Druckenmiller holds it, additionally, we don’t know which strikes or at what price he bought the options.
Bottom Line
For investors looking for active trading opportunities and enjoy the added complexity and potential returns of options, this is a trade worth considering.
I have heard investors talking about the closing of this IWM/SPY performance spread, but I believe the timing finally makes sense.
Want the latest recommendations from Zacks Investment Research? Today, you can download 7 Best Stocks for the Next 30 Days. Click to get this free report
SPDR S&P 500 ETF (SPY): ETF Research Reports
iShares Russell 2000 ETF (IWM): ETF Research Reports
