
Retail Earnings & Consumer Spending: A Closer Look
The U.S. economy is chugging along, with the growth pace moderately decelerating under the weight of the Fed’s tight monetary policy.
Many in the market had hoped that at the start of the year, the central bank would have started easing by now. But then inflation readings started misbehaving in the first few months of the year, changing this Fed outlook as a result. The expectation is still for one to two rate cuts this year, but there isn’t a lot of conviction in this outlook.
The timing of the first Fed rate cut is a huge preoccupation for stock market investors. However, with the unemployment rate at a multi-decade low, household buying power remains largely intact, even though most of the Covid savings have already been used up. And that’s what we saw in the Q1 earnings season, with consumer spending largely holding up.
While household finances in the aggregate are in reasonably good shape, there is stress at the lower end of the income distribution. Notwithstanding the still-plentiful jobs and the steady deceleration in inflation, the cumulative inflationary rise has exceeded the comparable wage gains. One data source shows a roughly +20% cumulative inflationary rise since February 2020, when Covid got underway.
While overall spending remains healthy, consumer preferences shifted in the post-Covid period towards services like leisure, entertainment, and travel and less towards ‘stuff’ like apparel, home goods, and the like.
It is this shift in consumer preferences that accounts for the performance variance between Walmart WMT and Target TGT. As we noted here before, Target’s merchandise leans heavily towards discretionary categories that aren’t a priority for consumers at present. On the other hand, Walmart has a vast grocery business and has been attracting an ever-growing share on higher income households attracted to the company’s convenient pick-up and delivery offerings.
With respect to the Retail sector 2024 Q1 earnings season scorecard, we now have results from 28 of the 34 retailers in the S&P 500 index. Regular readers know that Zacks has a dedicated stand-alone economic sector for the retail space, which is unlike the placement of the space in the Consumer Staples and Consumer Discretionary sectors in the Standard & Poor’s standard industry classification.
The Zacks Retail sector includes not only Walmart, Target, and other traditional retailers, but also online vendors like Amazon AMZN and restaurant players.
Total Q1 earnings for these 28 retailers that have reported are up +32% from the same period last year on +5.6% higher revenues, with 71.4% beating EPS estimates and 60.7% beating revenue estimates.
The comparison charts below put the Q1 beats percentages for these retailers in a historical context.
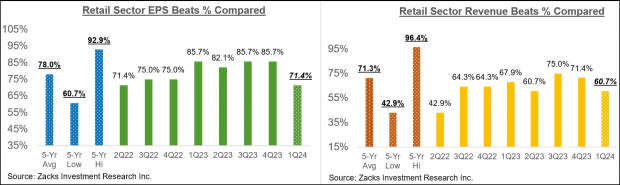
Image Source: Zacks Investment Research
As you can see here, these companies have been finding it hard to beat estimates.
With respect to earnings and revenue growth rates, we like to show the group’s performance with and without Amazon, whose results are among the 28 companies that have already reported. As we know, Amazon’s Q1 earnings were up +278.7% on +12.5% higher revenues, beating top- and bottom-line expectations.
As we all know, digital and brick-and-mortar operators have been converging for some time now, with Amazon now a decent-sized brick-and-mortar operator after Whole Foods and Walmart a growing online vendor. This long-standing trend got a huge boost from the Covid lockdowns.
The two comparison charts below show the Q1 earnings and revenue growth relative to other recent periods, both with Amazon’s results (left side chart) and without Amazon’s numbers (right side chart)
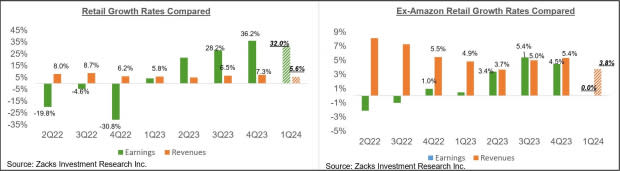
Image Source: Zacks Investment Research
As noted earlier, we have started seeing signs of stress at the lower-end of income distribution. One can intuitively project moderation in consumer spending as the economy further slows down under tighter monetary conditions. Inflation may be down from the multi-decade highs of a few quarters back, but it still remains a headwind, particularly for the lower end of income distribution. That said, the labor market remains very strong, with wages still going up.
Earnings Season Scorecard and This Week’s Earnings Reports
The bulk of the Q1 earnings season is now behind us, with results from 481 S&P 500 companies already out through Friday, May 24th. We have almost 100 companies reporting results this week, including 10 S&P 500 members. This week's line-up includes more retailers like Best Buy, Ulta, Dollar General, and Tech players like Salesforce, HP, and others.
Total Q1 earnings for these 81 index members are up +7% from the same period last year on +4.4% higher revenues, with 78.2% beating EPS estimates and 60.7% beating revenue estimates.
The comparison charts below put the Q1 earnings and revenue growth rates in a historical context.
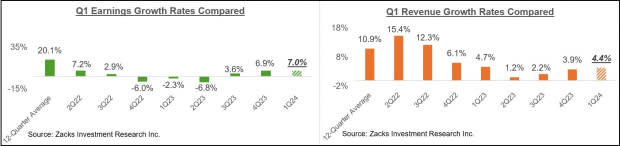
Image Source: Zacks Investment Research
We have been flagging an acceleration in the earnings growth trend, which becomes more apparent once the Bristol Myers drag is removed from the data; the pharma giant came out with a huge one-time charge. The chart below shows the Q1 earnings growth pace for these companies on an ex-BMY basis.
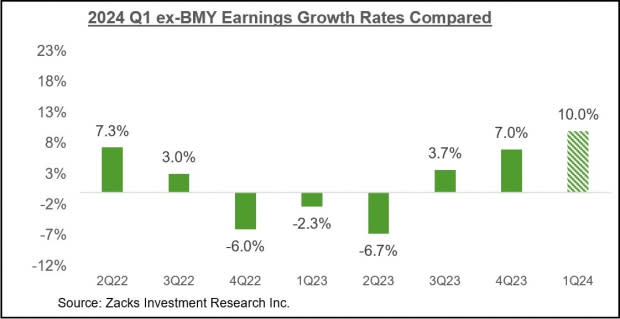
Image Source: Zacks Investment Research
Earnings growth for these companies would have been +10% instead of +7% had it not been for the substantial Energy sector drag.
The comparison charts below put the Q1 EPS and revenue beats percentages in a historical context.
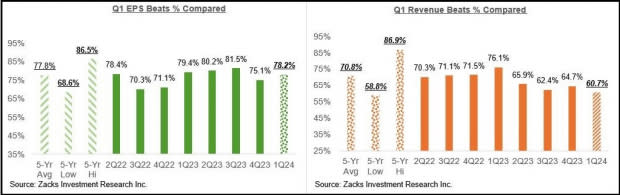
Image Source: Zacks Investment Research
As we noted in the context of the Retail sector, beats percentages have been on the weaker side for the index as a whole, with the variance relative to other recent periods particularly notable on the revenues side.
The Earnings Big Picture
Looking at Q1 as a whole, total S&P 500 earnings are expected to be up +6.8% from the same period last year on +4.3% higher revenues, which would follow the +6.9% earnings growth on +3.9% revenue gains in the preceding period.
The chart below shows current earnings and revenue growth expectations for 2024 Q1 in the context of where growth has been over the preceding four quarters and what is currently expected for the following three quarters.
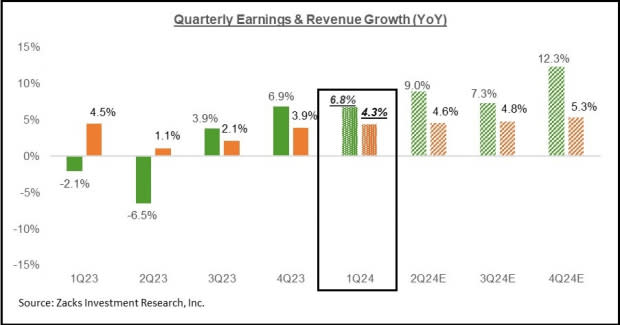
Image Source: Zacks Investment Research
As you likely know already, the Tech and Energy sectors are having the opposite effects on the aggregate growth picture. Excluding the Tech sector, Q1 earnings for the rest of the index would be down -0.7%, while the growth pace improves to +9.7% on an ex-energy basis.
For the current period (2024 Q2), total S&P 500 earnings are currently expected to be up +9% on +4.6% higher revenues.
The revisions trend has been very favorable for Q2 estimates, as the chart below shows.
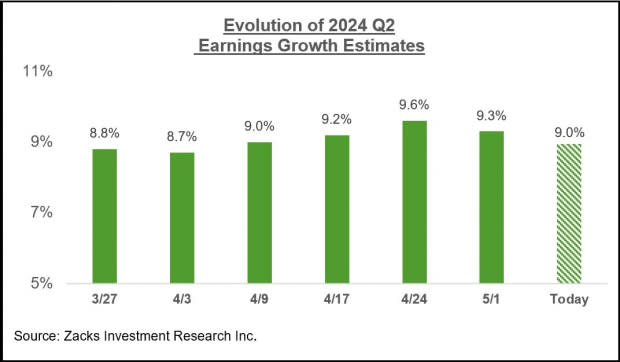
Image Source: Zacks Investment Research
Here is the Q2 revisions trend on an ex-Energy basis.
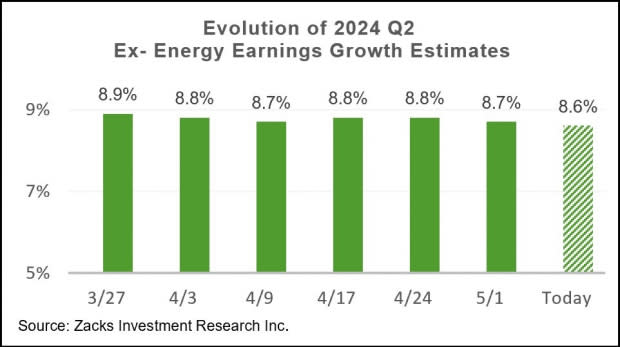
Image Source: Zacks Investment Research
Looking at the overall earnings picture on an annual basis, total 2024 S&P 500 earnings are expected to be up +9% on +1.6% revenue growth.
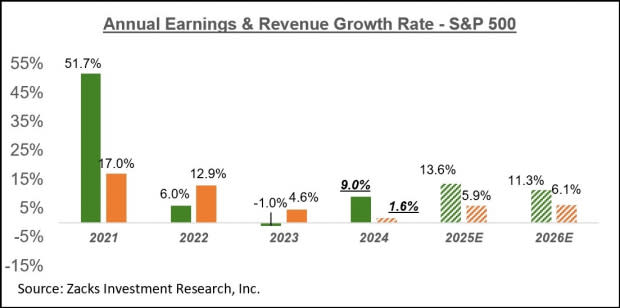
Image Source: Zacks Investment Research
For a detailed look at the overall earnings picture, including expectations for the coming periods, please check out our weekly Earnings Trends report >>>> Where is Earnings Growth Coming From?
Want the latest recommendations from Zacks Investment Research? Today, you can download 7 Best Stocks for the Next 30 Days. Click to get this free report
Amazon.com, Inc. (AMZN) : Free Stock Analysis Report
Target Corporation (TGT) : Free Stock Analysis Report
Walmart Inc. (WMT) : Free Stock Analysis Report
