
Sizzling Moment For Stocks? S&P 500's Path To 5,600 'Achievable During Summer Rally,' Says Wall Street Analyst
As summer heats up, so does the stock market. The S&P 500, as tracked by the SPDR S&P 500 ETF Trust (NYSE:SPY), has an intriguing historical seasonality pattern during presidential election years.
Looking back to 1928, an analysis conducted by Bank of America shows that the S&P 500 often kicks off summer with a solid performance in early June, which sets a bullish tone that tends to carry through the summer months.
“A late June lull could set up an early July rally,” says Stephen Suttmeier, CFA, CMT, an analyst at Bank of America.
Historical data underscores this trend: the last 10 sessions of June have shown uninspiring results, with the S&P 500 up only 48% of the time and an average return of just 0.02% (-0.19% median).
This means that during the final days of June, the market’s performance has historically been lackluster, with nearly half the days seeing slight losses. But this pause can be the calm before the storm, setting the stage for the strongest 10-day period of the year in early July.
But this pause can be a prelude to a significant upswing, setting the stage for the strongest 10-day period of the year in early July.
During this period, the S&P 500 has seen average returns of 1.54% and median returns of 1.91%. In simpler terms, early July has historically been a very good time for the stock market.
July and August: The Summer Rally Peaks
When it comes to presidential election years, the market’s behavior is even more pronounced as July and August typically yield positive returns.
The first 10 days of August are particularly strong, with the S&P 500 averaging a 1.53% gain. This is only slightly less than the 1.59% gain recorded in the first 10 days of June — historically the best window in election years.
“The SPX has continued to new all-time highs into mid-June, with the next major technical milestone being the 2022-2023 bullish cup and handle count in the 5600s, achievable during a summer rally,” Suttmeier wrote.
A “bullish cup and handle” is a technical chart pattern that suggests a potential for further gains.
It looks like a teacup on a chart, with a rounded bottom (the cup) and a slight downward drift (the handle). If this pattern holds, the S&P 500 could reach new highs in the 5600 range, indicating a strong summer rally.
S&P 500 Summer Seasonality: All Years
10-day Window | Month | Average Return | Median Return | Percentage of |
|---|---|---|---|---|
First 10 days | June | 0.67% | 1.03% | 60% |
Last 10 days | June | 0.02% | -0.19% | 48% |
First 10 days | July | 1.54% | 1.91% | 69% |
Last 10 days | July | 0.08% | 0.40% | 60% |
First 10 days | August | 0.23% | 0.03% | 51% |
Last 10 days | August | 0.10% | 0.17% | 52% |
First 10 days | September | -0.36% | -0.19% | 44% |
Last 10 days | September | -1.13% | -0.69% | 40% |
S&P 500 Summer Seasonality: Presidential Election Years
10-day Window | Month | Average Return | Median Return | Percentage of |
|---|---|---|---|---|
First 10 days | June | 1.59% | 1.47% | 64% |
Last 10 days | June | -0.38% | 0.52% | 54% |
First 10 days | July | 0.93% | 0.84% | 54% |
Last 10 days | July | 0.82% | 0.37% | 63% |
First 10 days | August | 1.53% | 0.87% | 63% |
Last 10 days | August | 0.81% | -0.01% | 50% |
First 10 days | September | -0.42% | -0.38% | 46% |
Last 10 days | September | -0.05% | -0.05% | 46% |
Mega Caps Lead
Another key trend highlighted by Bank of America is the overperformance of mega caps relative to large caps.
The S&P 100, which includes the U.S. 100 largest companies and tracked by the iShares S&P 100 ETF (NYSE:OEF), rallied 20% year to date, topping the S&P 500’s performance by 4 percentage points and matching that of the Nasdaq 100.
According to Suttmeier this is a bullish pattern, suggesting a potential late “1990s-style leadership melt-up” for mega caps compared to large caps. A “melt-up” refers to a strong market rally driven by a sudden surge in buying, rather than improving fundamentals.
Chart: Mega Caps Have Sharply Rallied Versus Large Caps (OEF/SPY Ratio)
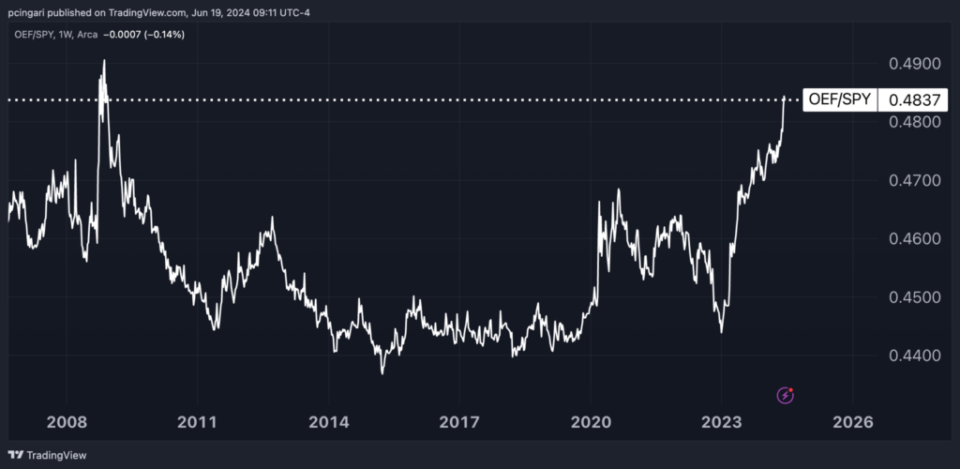
Photo: Shutterstock
"ACTIVE INVESTORS' SECRET WEAPON" Supercharge Your Stock Market Game with the #1 "news & everything else" trading tool: Benzinga Pro - Click here to start Your 14-Day Trial Now!
Get the latest stock analysis from Benzinga?
This article Sizzling Moment For Stocks? S&P 500's Path To 5,600 'Achievable During Summer Rally,' Says Wall Street Analyst originally appeared on Benzinga.com
© 2024 Benzinga.com. Benzinga does not provide investment advice. All rights reserved.
