
These Return Metrics Don't Make UEM Edgenta Berhad (KLSE:EDGENTA) Look Too Strong
Ignoring the stock price of a company, what are the underlying trends that tell us a business is past the growth phase? More often than not, we'll see a declining return on capital employed (ROCE) and a declining amount of capital employed. Ultimately this means that the company is earning less per dollar invested and on top of that, it's shrinking its base of capital employed. On that note, looking into UEM Edgenta Berhad (KLSE:EDGENTA), we weren't too upbeat about how things were going.
What Is Return On Capital Employed (ROCE)?
Just to clarify if you're unsure, ROCE is a metric for evaluating how much pre-tax income (in percentage terms) a company earns on the capital invested in its business. Analysts use this formula to calculate it for UEM Edgenta Berhad:
Return on Capital Employed = Earnings Before Interest and Tax (EBIT) ÷ (Total Assets - Current Liabilities)
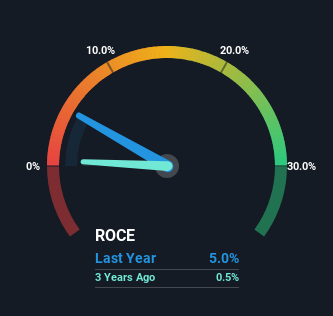
0.05 = RM100m ÷ (RM3.0b - RM940m) (Based on the trailing twelve months to December 2023).
Therefore, UEM Edgenta Berhad has an ROCE of 5.0%. Ultimately, that's a low return and it under-performs the Construction industry average of 6.6%.
Check out our latest analysis for UEM Edgenta Berhad
In the above chart we have measured UEM Edgenta Berhad's prior ROCE against its prior performance, but the future is arguably more important. If you'd like to see what analysts are forecasting going forward, you should check out our free analyst report for UEM Edgenta Berhad .
The Trend Of ROCE
We are a bit worried about the trend of returns on capital at UEM Edgenta Berhad. To be more specific, the ROCE was 8.5% five years ago, but since then it has dropped noticeably. On top of that, it's worth noting that the amount of capital employed within the business has remained relatively steady. Companies that exhibit these attributes tend to not be shrinking, but they can be mature and facing pressure on their margins from competition. If these trends continue, we wouldn't expect UEM Edgenta Berhad to turn into a multi-bagger.
Our Take On UEM Edgenta Berhad's ROCE
All in all, the lower returns from the same amount of capital employed aren't exactly signs of a compounding machine. Long term shareholders who've owned the stock over the last five years have experienced a 60% depreciation in their investment, so it appears the market might not like these trends either. With underlying trends that aren't great in these areas, we'd consider looking elsewhere.
On a final note, we've found 2 warning signs for UEM Edgenta Berhad that we think you should be aware of.
For those who like to invest in solid companies, check out this free list of companies with solid balance sheets and high returns on equity.
Have feedback on this article? Concerned about the content? Get in touch with us directly. Alternatively, email editorial-team (at) simplywallst.com.
This article by Simply Wall St is general in nature. We provide commentary based on historical data and analyst forecasts only using an unbiased methodology and our articles are not intended to be financial advice. It does not constitute a recommendation to buy or sell any stock, and does not take account of your objectives, or your financial situation. We aim to bring you long-term focused analysis driven by fundamental data. Note that our analysis may not factor in the latest price-sensitive company announcements or qualitative material. Simply Wall St has no position in any stocks mentioned.
