
Wall Street Bulls Look Optimistic About SYMBOTIC INC (SYM): Should You Buy?
The recommendations of Wall Street analysts are often relied on by investors when deciding whether to buy, sell, or hold a stock. Media reports about these brokerage-firm-employed (or sell-side) analysts changing their ratings often affect a stock's price. Do they really matter, though?
Let's take a look at what these Wall Street heavyweights have to say about Symbotic Inc. (SYM) before we discuss the reliability of brokerage recommendations and how to use them to your advantage.
SYMBOTIC INC currently has an average brokerage recommendation (ABR) of 1.62, on a scale of 1 to 5 (Strong Buy to Strong Sell), calculated based on the actual recommendations (Buy, Hold, Sell, etc.) made by 13 brokerage firms. An ABR of 1.62 approximates between Strong Buy and Buy.
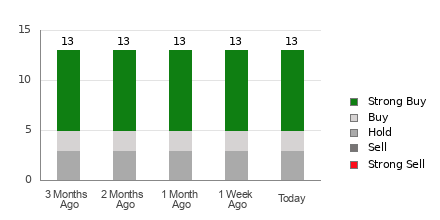
Of the 13 recommendations that derive the current ABR, eight are Strong Buy and two are Buy. Strong Buy and Buy respectively account for 61.5% and 15.4% of all recommendations.
Brokerage Recommendation Trends for SYM
Check price target & stock forecast for SYMBOTIC INC here>>>
The ABR suggests buying SYMBOTIC INC, but making an investment decision solely on the basis of this information might not be a good idea. According to several studies, brokerage recommendations have little to no success guiding investors to choose stocks with the most potential for price appreciation.
Are you wondering why? The vested interest of brokerage firms in a stock they cover often results in a strong positive bias of their analysts in rating it. Our research shows that for every "Strong Sell" recommendation, brokerage firms assign five "Strong Buy" recommendations.
This means that the interests of these institutions are not always aligned with those of retail investors, giving little insight into the direction of a stock's future price movement. It would therefore be best to use this information to validate your own analysis or a tool that has proven to be highly effective at predicting stock price movements.
Zacks Rank, our proprietary stock rating tool with an impressive externally audited track record, categorizes stocks into five groups, ranging from Zacks Rank #1 (Strong Buy) to Zacks Rank #5 (Strong Sell), and is an effective indicator of a stock's price performance in the near future. Therefore, using the ABR to validate the Zacks Rank could be an efficient way of making a profitable investment decision.
Zacks Rank Should Not Be Confused With ABR
Although both Zacks Rank and ABR are displayed in a range of 1-5, they are different measures altogether.
The ABR is calculated solely based on brokerage recommendations and is typically displayed with decimals (example: 1.28). In contrast, the Zacks Rank is a quantitative model allowing investors to harness the power of earnings estimate revisions. It is displayed in whole numbers -- 1 to 5.
It has been and continues to be the case that analysts employed by brokerage firms are overly optimistic with their recommendations. Because of their employers' vested interests, these analysts issue more favorable ratings than their research would support, misguiding investors far more often than helping them.
On the other hand, earnings estimate revisions are at the core of the Zacks Rank. And empirical research shows a strong correlation between trends in earnings estimate revisions and near-term stock price movements.
In addition, the different Zacks Rank grades are applied proportionately to all stocks for which brokerage analysts provide current-year earnings estimates. In other words, this tool always maintains a balance among its five ranks.
There is also a key difference between the ABR and Zacks Rank when it comes to freshness. When you look at the ABR, it may not be up-to-date. Nonetheless, since brokerage analysts constantly revise their earnings estimates to reflect changing business trends, and their actions get reflected in the Zacks Rank quickly enough, it is always timely in predicting future stock prices.
Should You Invest in SYM?
In terms of earnings estimate revisions for SYMBOTIC INC, the Zacks Consensus Estimate for the current year has remained unchanged over the past month at -$0.07.
Analysts' steady views regarding the company's earnings prospects, as indicated by an unchanged consensus estimate, could be a legitimate reason for the stock to perform in line with the broader market in the near term.
The size of the recent change in the consensus estimate, along with three other factors related to earnings estimates, has resulted in a Zacks Rank #3 (Hold) for SYMBOTIC INC. You can see the complete list of today's Zacks Rank #1 (Strong Buy) stocks here >>>>
It may therefore be prudent to be a little cautious with the Buy-equivalent ABR for SYMBOTIC INC.
Want the latest recommendations from Zacks Investment Research? Today, you can download 7 Best Stocks for the Next 30 Days. Click to get this free report
Symbotic Inc. (SYM) : Free Stock Analysis Report
