
Dave & Buster's (PLAY) Q1 Earnings Miss Estimates, Stock Down
Dave & Buster's Entertainment, Inc. PLAY reported tepid first-quarter fiscal 2024 results, with both earnings and revenues missing their respective Zacks Consensus Estimate. Both metrics declined on a year-over-year basis.
The company reported tougher year-over-year comparisons in January and February, exacerbated by challenging weather conditions. Sales during this period remained uneven, owing to economic difficulties in the lower-income demographics. The condensed and shorter spring break period further affected results, limiting the usual extended period for increased activities.
Despite observing some improvements in traffic, PLAY noted a negative single-digit trend in comparable sales. The company remains cautious, given the challenging macroeconomic environment.
Following the results, the company’s shares fell 11.5% during the after-hours trading session on Jun 12.
Earnings & Revenues in Detail
During the fiscal fourth quarter, the company reported adjusted earnings per share (EPS) of $1.12, which missed the Zacks Consensus Estimate of $1.56. In the year-ago quarter, it reported an adjusted EPS of $1.52.
Dave & Buster's Entertainment, Inc. Price, Consensus and EPS Surprise
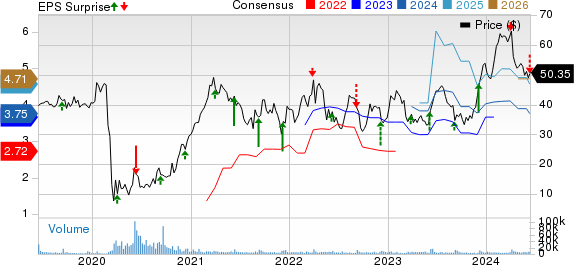
Dave & Buster's Entertainment, Inc. price-consensus-eps-surprise-chart | Dave & Buster's Entertainment, Inc. Quote
Quarterly revenues of $588.1 million missed the consensus mark of $611 million. The top line fell 1.5% from $597.3 million reported in the prior-year quarter.
Food and Beverage revenues (34.4% of total revenues in the reported quarter) declined 0.9% year over year to $202.4 million. Entertainment revenues (65.6%) fell 1.9% year over year to $385.7 million.
Comps Details
During the quarter under discussion, comparable store sales (including Main Event branded stores) declined 5.6% year over year. We projected the metric to decline 6.3%.
Operating Highlights
During the quarter under discussion, operating income amounted to $85.5 million compared with $121.4 million in the prior-year quarter. The operating margin was 14.5% compared with 20.2% in the year-ago quarter. Our estimate for the metric was 16.6%.
Adjusted EBITDA came in at $159.1 million compared with $182.1 million in the year-earlier quarter. The downside was primarily driven by expenses related to labor and marketing for the rollout of a new menu and service model, the implementation of several new technology systems and an unsuccessful test of an incremental marketing campaign. Our estimate for the metric was $164 million.
Balance Sheet
As of May 5, 2024, cash and cash equivalents were $32.1 million compared with $37.3 million as of Feb 4, 2024.
Year to date (as of May 5, 2024), the company repurchased 1 million shares for an aggregate cost of $50 million. As of May 5, the company had $150 million available for the buyback program.
At the fiscal first-quarter end, net long-term debt totaled approximately $1.29 billion compared with $1.28 billion in the prior quarter.
Zacks Rank & Key Picks
Dave & Buster currently carries a Zacks Rank #3 (Hold).
Some better-ranked stocks in the Zacks Retail-Wholesale sector are:
Wingstop Inc. WING sports a Zacks Rank #1 (Strong Buy) at present. It has a trailing four-quarter negative earnings surprise of 21.4%, on average. The stock has surged 114.4% in the past year. You can see the complete list of today’s Zacks #1 Rank stocks here.
The Zacks Consensus Estimate for WING’s 2024 sales and earnings per share (EPS) suggests a rise of 27.5% and 36.7%, respectively, from the year-ago levels.
Brinker International, Inc. EAT carries a Zacks Rank #2 (Buy) at present. It has a trailing four-quarter earnings surprise of 213.4%, on average. EAT’s shares have risen 88.6% in the past year.
The Zacks Consensus Estimate for EAT’s 2024 sales and EPS indicates 5% and 41.3% growth, respectively, from the year-earlier actuals.
El Pollo Loco Holdings, Inc. LOCO currently carries a Zacks Rank #2. It has a trailing four-quarter earnings surprise of 19.4%, on average. LOCO’s shares have risen 8.2% in the past year.
The Zacks Consensus Estimate for LOCO’s 2025 sales and EPS indicates 3.8% and 9.9% growth, respectively, from the prior-year figures.
Want the latest recommendations from Zacks Investment Research? Today, you can download 7 Best Stocks for the Next 30 Days. Click to get this free report
Brinker International, Inc. (EAT) : Free Stock Analysis Report
El Pollo Loco Holdings, Inc. (LOCO) : Free Stock Analysis Report
Dave & Buster's Entertainment, Inc. (PLAY) : Free Stock Analysis Report
Wingstop Inc. (WING) : Free Stock Analysis Report
