
H.B. Fuller (FUL) Q2 Earnings and Sales Beats Estimates
H.B. Fuller Company FUL reported its financial results for second-quarter fiscal 2024. The company posted a net income of $51 million, or 91 cents per share. Adjusted net income for the quarter was $64 million, with adjusted earnings per share (EPS) at $1.12, resulting in an earnings surprise of 6.7%.This marks a 20% year-on-year increase driven by robust growth in operating income.
The company's net revenues in the quarter came in at $917.1 million, up 2.1% from the previous year's $898.2 million. The company also beat the Zacks Consensus Estimate for revenues of $910.8 million by 0.7%.
Volumes rose 3.3%, balanced by expected pricing adjustments, resulting in flat organic revenue compared with the previous year’s levels. All three global business units experienced volume growth. Foreign currency translation had an unfavorable impact on net revenues by 1.7%, while acquisitions contributed 3.9% to the increase.
Gross profit was $282 million, with adjusted gross profit at $286 million. The adjusted gross profit margin was 31.1%, up 210 basis points year on year, driven primarily by pricing and raw material cost actions, restructuring benefits and volume leverage.
Selling, general and administrative (SG&A) expenses amounted to $181 million in the quarter, with adjusted SG&A at $173 million compared with $159 million in second-quarter fiscal 2023. The increase in adjusted SG&A was due to acquisitions, wage and service inflation and higher variable compensation expenses, partially offset by restructuring savings.
Adjusted EBITDA for the second quarter reached $157 million, a 10% increase year-on-year. This growth was driven by pricing and raw material cost actions, higher volume, restructuring savings, and gains from recent acquisitions. The adjusted EBITDA margin rose 120 basis points year-on-year to 17.1%.
Financials
At the end of the second quarter of fiscal 2024, H.B. Fuller's net debt stood at $1.9 billion, reflecting a sequential increase of $0.2 billion and a year-on-year increase of $0.1 billion. This rise in net debt was mainly due to the acquisition of ND Industries, Inc during the quarter.
Cash flow from operations for the first six months of fiscal 2024 was $129 million compared with $108 million during the comparable period of the previous fiscal year.
Outlook
For fiscal 2024, H.B. Fuller expects net revenue growth to be in the range of 2% to 4%, with organic revenue flat to up 2% year-on-year. Net interest expense is forecasted to be around $130 million.
Adjusted EPS is anticipated to range from $4.20 to $4.45, indicating year-on-year growth of 9-15%. Operating cash flow is projected to be between $300 million and $350 million.
Adjusted EBITDA for fiscal 2024 is expected to be between $620 million and $640 million, reflecting growth of 7-10% year on year. For the third quarter, adjusted EBITDA is projected in the range of $165-$175 million.
Price Performance
The company’s shares have risen 7.4% in the past year compared with the industry’s 14.8% decline.
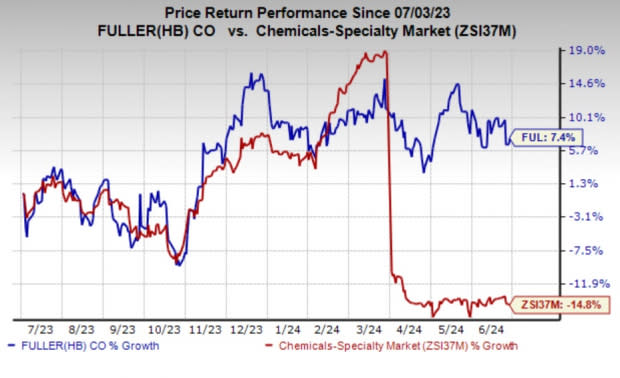
Image Source: Zacks Investment Research
Zacks Rank & Other Key Picks
H.B. Fuller currently carries a Zacks Rank #2 (Buy).
Some other top-ranked stocks in the Basic Materials space are Carpenter Technology Corporation CRS, ATI Inc. ATI and Ecolab Inc. ECL. Carpenter Technology sports a Zacks Rank #1 (Strong Buy), and ATI and Ecolab carry a Zacks Rank #2. You can see the complete list of today’s Zacks #1 Rank stocks here.
The Zacks Consensus Estimate for CRS’s current-year earnings is pegged at $4.35, indicating a year-over-year rise of 282%. CRS’ earnings beat the Zacks Consensus Estimate in three of the last four quarters while matching it once, the average earnings surprise being 15.1%. The company’s shares have soared 94.7% in the past year.
The Zacks Consensus Estimate for ATI’s current-year earnings is pegged at $2.45, which has gone up 8.4% in the last 60 days. ATI’s earnings beat the Zacks Consensus Estimate in each of the last four quarters, the average earnings surprise being 8.34%, on average. The stock has rallied 24.3% in the past year.
The Zacks Consensus Estimate for Ecolab's current-year earnings is pegged at $6.59, indicating a rise of 26.5% from the year-ago levels. ECL beat the consensus estimate in each of the last four quarters, the average earnings surprise being 1.3%. The stock has rallied nearly 27.6% in the past year.
Want the latest recommendations from Zacks Investment Research? Today, you can download 7 Best Stocks for the Next 30 Days. Click to get this free report
Ecolab Inc. (ECL) : Free Stock Analysis Report
ATI Inc. (ATI) : Free Stock Analysis Report
Carpenter Technology Corporation (CRS) : Free Stock Analysis Report
H. B. Fuller Company (FUL) : Free Stock Analysis Report
